How Much of Growth Is the Company?
Alpha growth — the part of revenue growth a firm's environment does not explain — validated on synthetic data, then measured on seventeen years of SEC filings.
John Kinson 4 min read
A company grows revenue 14%. Its industry grew 9%, the macro helped, and an acquisition closed mid-year. How much was the company? Define alpha growth as actual growth minus expected growth, where “expected” comes from models trained only on prior years. This piece builds that measurement, validates it on synthetic data where the true answer is known, then runs it on 497 current S&P 500 firms — 7,320 firm-years of 10-K revenue, fiscal 2009–2025.
Findings
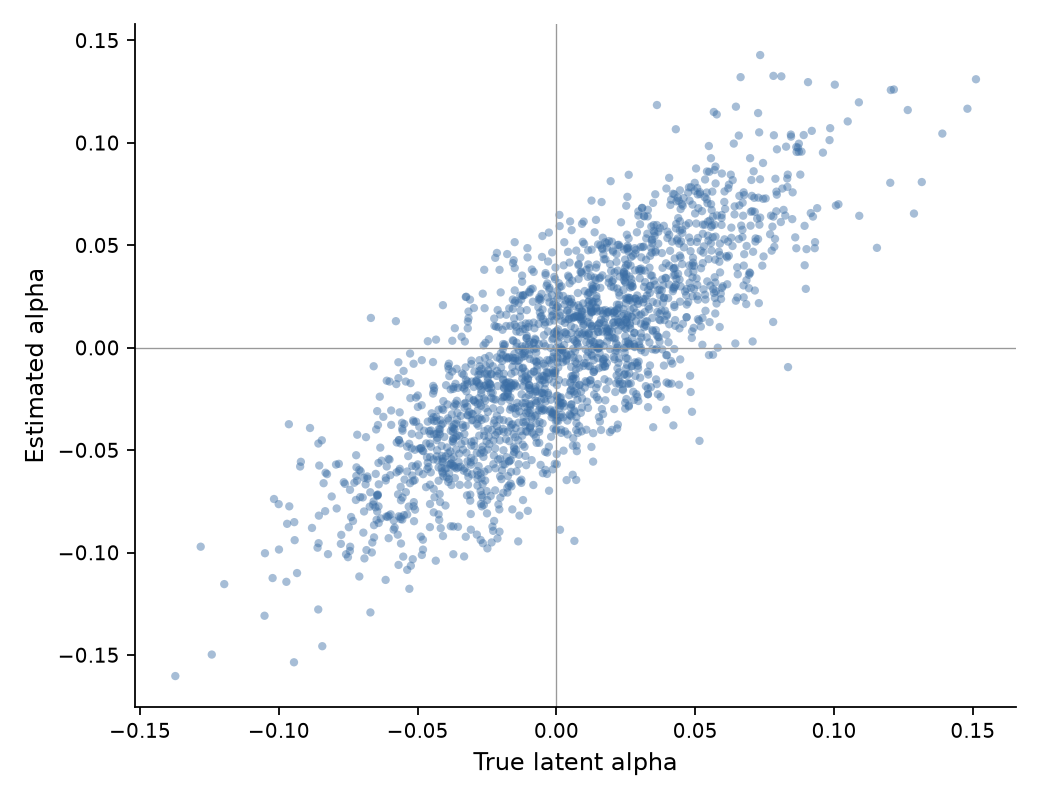
- The machinery works where it can be checked. On a synthetic panel with known latent alpha, the rolling regression recovers truth at 0.81 correlation and finds 60% of the true top decile. Naive benchmarks trail (0.70 industry-relative, 0.63 lagged peers).
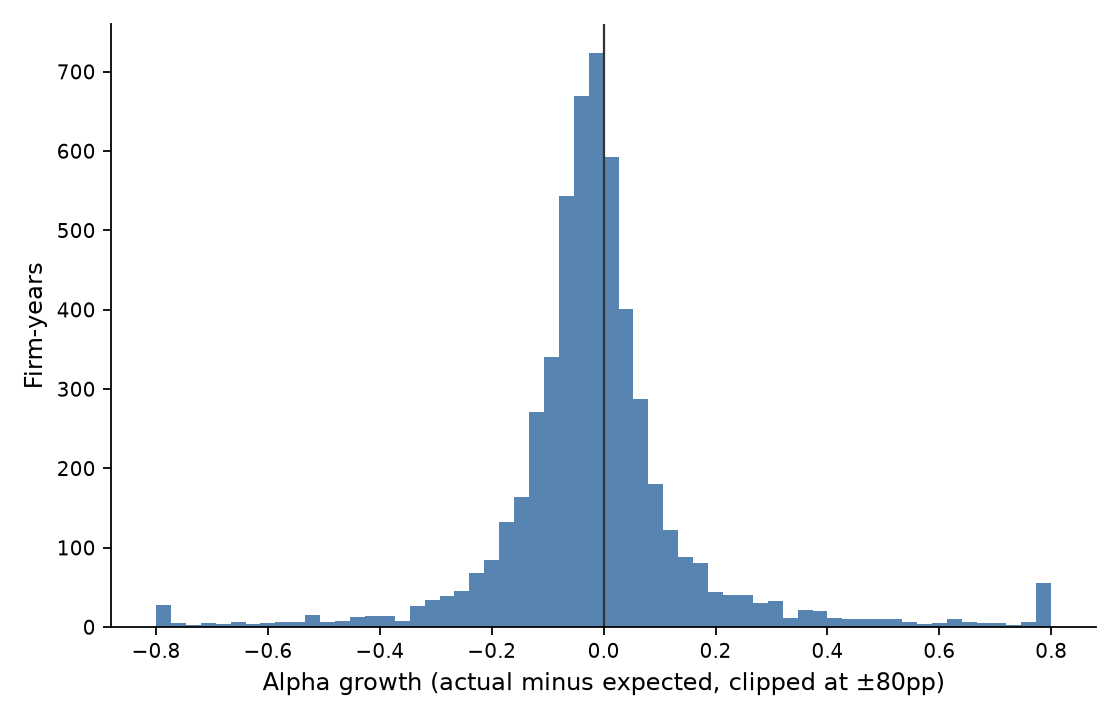
- Real alpha is ~7× noisier than simulation. Standard deviation ≈ 21 points; only 40% of firm-years land within ±5 points of expectation. Annual revenue against an annual expectation is a coarse instrument.
- Complexity does not buy accuracy — it changes the question. On real data, the simple industry benchmark predicts next-year growth as well as the regression (RMSE 0.209 for both, same firm-years).
- Beat your industry, you’ll probably repeat: 60%. Beat a model that also knows your track record: 47% — a coin flip. Industry-relative alpha persists year to year (correlation 0.19); regression-relative alpha does not (−0.02). Once the expectation has read your history, next year’s surprise is unforecastable.
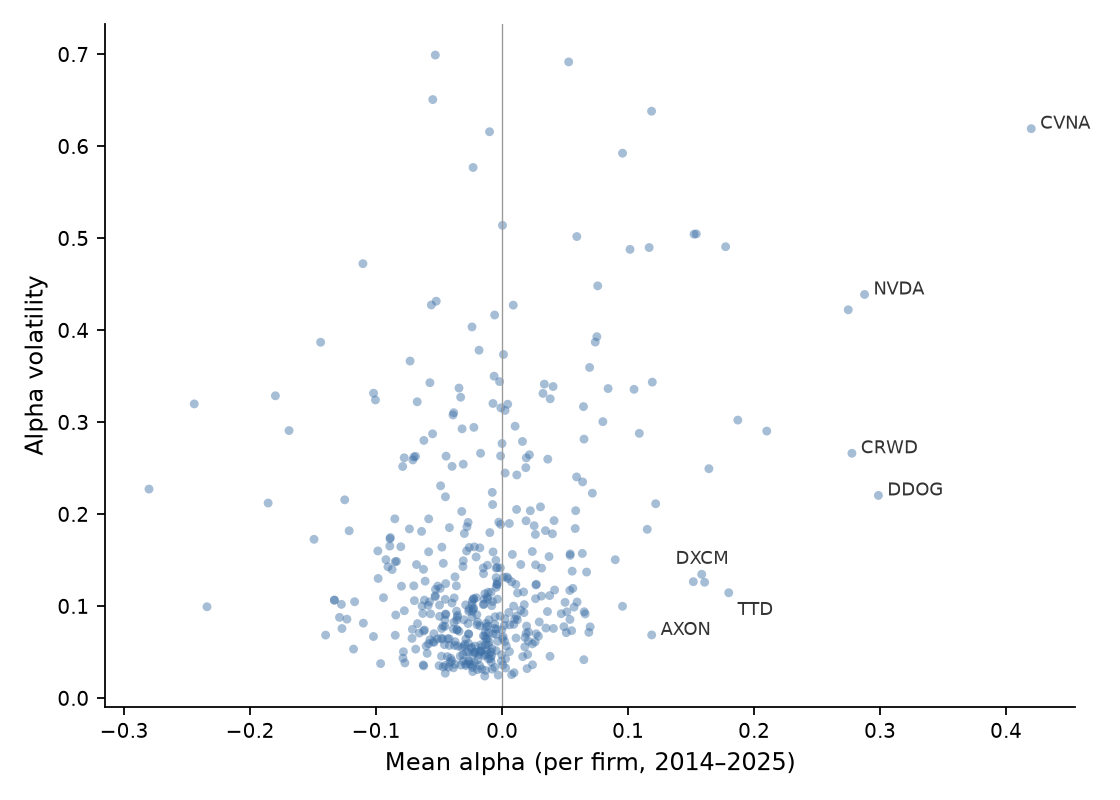
- The framework surfaces the right firms unprompted. Ranked by persistent alpha: Datadog (above expectation 8 years of 8), Trade Desk (9 of 9), Axon (11 straight), CrowdStrike, Dexcom. Nvidia’s data-center years are the largest surprise in the panel — ~130 points above even the regression’s expectation.
Method, briefly
“Expected” must respect three rules: no information from the year being graded (every model trains strictly on prior years, and an audit fails the run otherwise); exposure is not skill (industry, macro, size, and acquisition effects belong on the expected side); a residual is not a verdict (it mixes skill, luck, and everything the model omits).
Four benchmarks, simplest first: industry growth; trailing three-year peer mean (leave-one-out, completed years only); rolling panel OLS on industry, macro, size, prior growth and sector controls, refit yearly on an expanding window; a ridge variant as a robustness check. Disagreement between them is information — brilliant against your industry but ordinary against the regression means favorable exposures, not alpha.
Synthetic validation comes first because on real data true alpha is unobservable — there is no answer sheet. The simulation writes one; the estimators never see it.
Two lessons from building it:
Leakage lives in feature construction, not train/test splits. Despite strict time splits and a training-window audit, one leak shipped: first-year prior growth was filled with a full-sample industry median — future years included. The fix-class is a truncation-invariance test: rebuild features on a panel cut at year t; if deleting the future changes the past, a feature was reading the future.
The subtraction defines the alpha. The regression conditions on a firm’s own prior growth, so persistent excellence gets absorbed into “expected” — which is exactly why its residual doesn’t persist (finding 4) while the industry benchmark’s does. Neither is wrong; they answer different questions. An alpha estimate that doesn’t state its counterfactual isn’t yet a claim.
Caveats
- The universe is today’s S&P 500: survivor-biased by construction, and the persistence numbers are flattered by it.
- Real-data alpha is gross: acquisitions live inside it, so a disciplined roll-up looks like organic outperformance.
- Revenue is one axis. Carvana’s alpha — among the largest in the panel — was bought with years of negative margins this measure does not see.
- The residual is still a residual: skill, luck, and omissions in unknown proportions.
Next: a quality axis (margins, capital efficiency) and a universe that includes the firms that didn’t survive. What the two stages deliver now is narrow but real — a number with a stated counterfactual, an auditable training window, and a feature pipeline that provably cannot read the future. Which is more than can be said for “great management team.”