The Consent-Control Gap
Why Voting No Longer Reaches Far Enough
Abstract
Britain’s democratic discontent is usually described in the language of mood: a collapse of trust, a surge of populism, a decline of competence, a fraying of institutions. This paper argues that the diagnosis is structural before it is affective. The vote still works. What has weakened is the relationship between voting and visible consequence.
The phenomenon is reproducible across policy domains: government promises 300,000 homes a year and never meets the target; commits to NHS waiting-time standards repeatedly unmet; legislates net zero and watches the grid connection queue grow into the hundreds of gigawatts. In each case, the democratic promise enters a machinery through which it dissipates by stages. The result is a consent-control gap: the distance between democratic authorisation and what can actually be seen, commanded, or judged.
Using Britain as a case study, the paper draws on trust data, comparative institutional design across five democracies, and four detailed policy machinery maps to argue that Britain has accumulated an unusually damaging configuration on three variables that determine the shape of the gap in any complex democracy. The answer is not less democracy or louder democracy, but more capable democracy. Consent remains the source of legitimacy. But consent is not a delivery system.
Keywords
democratic theory, British politics, public administration, trust, institutional design
1. The Consent-Control Gap in Complex Democracies
1.1 The Modest Promise
The strange thing about British democratic life is not that elections have stopped mattering. They matter enormously. Governments change. Mandates are claimed. Majorities are formed. The trouble begins after the vote.
The mandate enters the machinery - planning committees, regulators, trusts, courts, contractors, Treasury rules, local authorities, statutory consultees, markets - and emerges, years later, as something smaller, slower, stranger, or not at all. A government promises more homes, but delivery depends on local plans, planning committees, statutory consultees, developers, land markets, infrastructure capacity, construction labour, and interest rates. A government promises shorter NHS waiting lists, but delivery depends on workforce pipelines, hospital capacity, social care discharge, Treasury settlements, NHS England, local trusts, and demographic demand. In each case, the democratic promise is simple enough to campaign on. The machinery required to fulfil it is neither simple nor fully commanded by the people elected to make the promise.
This is the phenomenon the paper investigates. It is not new - some version of it is implicit in any complex modern state. It is also not, despite appearances, evidence that democracy has stopped working. The vote still works. The trouble is that it no longer reaches far enough.
What follows from this is more demanding than the standard diagnoses suggest. Democracy has never meant direct public control over outcomes. No election can abolish scarcity, dissolve complexity, eliminate trade-offs, neutralise bad luck, repeal institutional inertia, or compensate for human incompetence. The promise of representative democracy was always more modest: that citizens could authorise governments, governments could act through institutions, and citizens could later judge the consequences. It was a three-part promise, not a single act: consent, machinery, judgement.
This framing matters because it forecloses a particular kind of nostalgia. The argument of this paper is not that democracy “used to work” and has now stopped. It is that even the modest chain described above - consent, machinery, judgement - has become difficult to see, operate, or trust in modern Britain.
The claim is therefore not that Britain invented the consent-control gap, nor that institutional complexity can be abolished. The claim is that British institutional development has widened the gap in particular ways: centralising political responsibility while dispersing operational control; multiplying delivery bodies while weakening local capacity; and preserving a political language of executive command long after the machinery of delivery became distributed.
That obscurity is the subject of this paper. The pattern is observable across policy domains, repeats across changes of government, and admits of a name: the consent-control gap.
1.2 Definition
The consent-control gap is the distance between democratic authorisation and practical governability: the point at which voters can formally choose leaders and policies, but cannot clearly cause, observe, or judge the institutional action required to produce outcomes.
Three terms in that definition are doing the analytical work and deserve unpacking.
Cause refers to whether electoral choice can be plausibly traced into institutional action. When voters elect a government promising more homes, lower NHS waiting times, cheaper energy, or higher educational attainment, does that mandate actually reach the institutions that determine those outcomes? Or does it dissipate across regulators, local authorities, contractors, courts, market actors, and fiscal constraints that were never on the ballot?
Observe refers to legibility. Even when institutions act, can voters see what is happening, who is responsible, and where the bottlenecks lie? A delivery chain with twenty handoffs and no public-facing dashboard is, for democratic purposes, invisible. Action without visibility cannot generate accountability.
Judge refers to attribution. To exercise democratic judgement, voters need to know who deserves credit and blame. When delivery depends on the simultaneous functioning of central government, devolved administrations, local councils, independent regulators, statutory bodies, private contractors, professional bodies, international agreements, and global markets, attribution becomes opaque. Voters are left to punish or reward through guesswork.
When all three terms break down, electoral consent remains formally intact but becomes functionally weakened. The vote still counts. Too often, it no longer reaches the machinery that determines the outcome.
This paper focuses on what happens after democratic consent is given: whether mandates can be translated into action and judgement. It does not attempt a full account of how preferences are formed before consent, including the role of media systems, algorithmic influence, and political persuasion. Those forces matter, but they concern the formation of consent; the consent-control gap concerns its institutional translation.

1.3 The Shift in Governance
The deeper question is why the gap is widening. The proximate answer is that representative democracy still describes itself in the language of institutional command, while modern governance increasingly behaves as a complex system.
The command model is implicit in most political rhetoric. Voters choose. Governments decide. Departments execute. Citizens judge. Authority flows downward through a recognisable hierarchy. Manifestos describe outcomes the executive will deliver. Failure is laid at the executive’s door.
The complex-system reality is different. Power over material outcomes is distributed across agencies, regulators, courts, markets, local authorities, private contractors, fiscal rules, infrastructure networks, professional bodies, and international constraints. These actors operate on different timescales, answer to different authorities, follow different incentives, and interact in ways that are often opaque even to those inside them. Outcomes emerge from the interaction of the system rather than from the decisions of any single actor. A government does not “build houses”; it adjusts parameters in a vast machinery of incentives, permissions, capital flows, labour markets, and local politics that may or may not produce houses on a useful timescale.
The consent-control gap opens where the rhetoric of democratic command meets the reality of distributed governance. The gap is not new; some version of it is inherent in any complex modern state. The question is not whether a democracy has such a gap, but how wide, how legible, and how governable its version becomes. The paper’s claim about Britain is not that the gap is uniquely present here, but that British institutional choices have produced a version of it that is wider, less legible, and less governable than necessary.
Britain’s gap is wide. It is the central claim of this paper that it has become one of the defining features of British democratic experience: a recurring pattern in which voters can authorise change without being able to see, command, or judge the machinery through which change must occur.
The enemy of democratic control is not complexity itself. It is illegible complexity: power distributed across systems voters cannot see, influence, or judge.
1.4 The Civic Ecology of Control
The consent-control gap is not only institutional. It is also civic. A functioning representative democracy depends on more than elections: parties, unions, local media, civic associations, public meetings, consultations, parliamentary casework, pressure groups, and informal networks of political knowledge all help citizens identify problems, understand where power sits, and apply pressure between elections. These institutions are the connective tissue between consent and control.
In Britain, much of this connective tissue has thinned. Mass party membership is far below its mid-twentieth-century peak and has declined over the long run, notwithstanding temporary surges around Brexit and the Corbyn period.1 Trade union membership has fallen from its 1979 peak.2 The local press, historically one of the main explainers of where institutional power sits, has contracted sharply, with hundreds of local print titles closing since 2005 and major reductions in regional newsroom capacity.3 Public knowledge of local government is also weak: surveys have repeatedly found low recognition of councils and councillors.4
The point is not to scold citizens for failing to attend committee meetings or read planning notices. Most people are busy, tired, and not employed as constitutional plumbing inspectors. The argument is structural: democratic control increasingly requires levels of civic time, institutional literacy, and persistence that ordinary citizens cannot reasonably be expected to supply unaided. When the machinery becomes more complex and the civic ecology becomes thinner, the vote is left carrying too much weight.
This matters for the analytical argument that follows. The consent-control gap has two sides, and they compound. One is institutional: governance has become more fragmented, more technical, and harder to see. The other is civic: the institutions that once helped citizens interpret and influence that complexity have weakened. A fragmented institutional landscape combined with a thinned civic ecology produces a democracy in which voting carries the full load of legitimacy while doing little of the analytical and corrective work that legitimacy requires.
This dual structure - institutional fragmentation compounded by civic thinning - is the proper frame for understanding the consent-control gap. Understanding it requires attention to both sides. The remainder of this paper focuses primarily on the institutional side, where the evidence is more directly testable, but the civic side should be held in view throughout: institutional architecture only does democratic work to the extent that citizens are equipped to engage with it.
1.5 What the Gap Is Not
The consent-control gap overlaps with but is distinct from several adjacent concepts in the literature. Clarity here matters because the proposed remedies differ depending on which diagnosis one accepts.
It is not democratic backsliding in the standard sense. Britain’s electoral institutions remain competitive and power transfers peacefully. The gap is compatible with formally healthy democracy; it concerns what consent reaches, not whether consent is given.
It is not simply post-democracy as Colin Crouch described it - the hollowing of political contestation by economic and technocratic capture. Crouch’s framework is concerned with elite displacement of democratic politics. The consent-control gap can exist even when contestation is vigorous and elites are constrained: it is about institutional architecture, not only elite capture or class power.
It is not equivalent to state capacity failure, though the two are closely linked. State capacity is necessary for closing the gap, but not sufficient. A state with high technical capacity can still suffer a consent-control gap if its delivery machinery is illegible to voters or insulated from democratic feedback. State capacity asks whether the state can do things; the consent-control gap asks whether democratic authorisation can find, steer, observe, and judge the institutions that do them. Britain’s problem is not only weak capacity. It is weak democratic reach.
It is not principal-agent drift in the standard sense, though it includes it. Principal-agent problems describe the difficulty of aligning the actions of one institutional actor with the preferences of another. The consent-control gap is a chained principal-agent problem at the scale of an entire polity, where the ultimate principal - the electorate - is asked to monitor an institutional network it cannot see clearly.
What the consent-control gap names is the structural condition that arises when these phenomena combine: distributed institutional power, asymmetric information, weak feedback loops, and a rhetorical framework inherited from a simpler form of state. It is the failure mode that emerges when democratic consent is asked to do work it was not designed to do alone.
1.6 Why This Diagnosis Matters
If the consent-control gap is real, it changes how Britain’s democratic discontent should be understood. Trust decline, populist pressure, institutional decay, and competence failure are not imaginary. But they are partial diagnoses. Each describes a symptom of a deeper architectural problem: the weakening relationship between public authorisation and institutional action.
This also explains why the two most familiar remedies are insufficient. Technocracy tries to improve control by insulating decision-making from democratic pressure. Populism tries to restore consent by intensifying democratic theatre and attacking institutional constraints. Both respond to something real. Neither fully addresses the gap between mandate and machinery.
The question, then, is not whether Britain should defend the existing settlement against its discontents, but whether the settlement itself can be made capable of governing the complexity it now inherits. The remainder of this paper develops the argument through trust data, comparative institutional analysis, and four machinery maps: housing, the NHS, energy, and education. Together, they show a repeated pattern.
Consent remains the source of legitimacy. But consent is not a delivery system.
2. Earned Distrust
2.1 Forty Years of Falling
The first thing to notice about British political trust is that it is no longer a short-term phenomenon. Single-year falls in trust around particular scandals, elections, or leaders are unremarkable in any democracy. What distinguishes the current pattern is its duration, its breadth across institutions, and its consistency across measurement traditions.
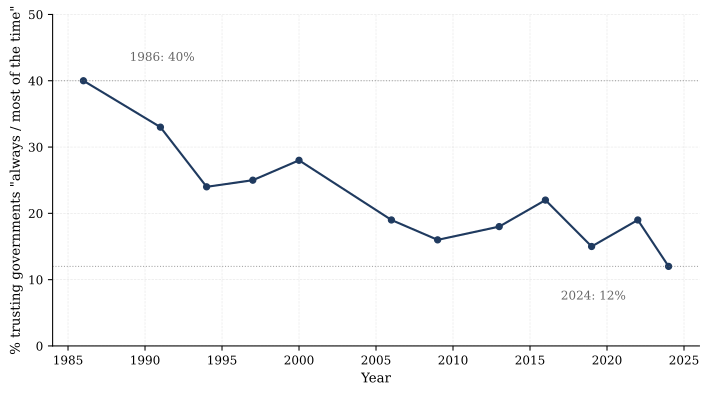
The British Social Attitudes survey, conducted annually since 1986, asks respondents whether they trust governments of any party to place the needs of the nation above the interests of their own political party “just about always” or “most of the time.” In the mid-1980s, around 40 per cent answered in those terms. In the latest published BSA data, the figure is around 12-14 per cent, depending on fieldwork year.5 That is not a swing tied to a particular government, since the question deliberately asks about governments in general, and the trajectory holds across changes of party. It is a slow, sustained decline over nearly four decades.
The British Election Study Internet Panel produces a complementary measure for the more recent period. Between 2014 and 2024, the proportion of respondents reporting low or no trust in MPs rose from 54 per cent to 76 per cent.6 Over the same period, the proportion reporting “no trust at all” in politicians rose from 16 per cent in 2015 to 35 per cent in 2024.7 These are not the kinds of shifts that occur because of one bad news cycle. They describe a stratum of the population that has moved, over a decade, from sceptical engagement to settled disengagement.
The Ipsos Veracity Index, which tracks how much the public trusts different professions to tell the truth, places politicians in 2025 at 9 per cent and government ministers at 14 per cent - the bottom of the ranking, below estate agents.8 These figures are point-in-time and should be treated as such, but they corroborate the longer series: trust in the political class, by multiple measurement traditions and over multiple decades, has declined to historic lows.
Table 2.1: Headline trust measures, multiple sources
| Measure | Source | Period | Direction |
|---|---|---|---|
| Trust governments to put nation above party “always / most of the time” | BSA / NatCen | mid-1980s to latest | ~40% → 12-14% |
| Low or no trust in MPs | BES / UK Parliament POST | 2014-2024 | 54% → 76% |
| “No trust at all” in politicians | BES | 2015-2024 | 16% → 35% |
| Trust in national government | OECD Drivers of Trust | 2023 | UK 27% vs OECD avg 39% |
| Feel they have a say in what government does | OECD Drivers of Trust | 2023 | UK 20% vs OECD avg 30% |
| Trust in government, by perceived voice | OECD Drivers of Trust | 2023 | 69% (have say) vs 22% (no say) |
| Trust politicians to tell the truth | Ipsos Veracity Index | 2025 | 9% |
2.2 An Outlier Among Democracies
Cross-national data complicates any reading of trust decline as a generically Western phenomenon. The OECD’s Survey on Drivers of Trust in Public Institutions, conducted across thirty member countries in late 2023, found that 27 per cent of UK respondents reported high or moderately high trust in their national government, compared with an OECD average of 39 per cent. The UK ranked twenty-eighth of thirty.9
Within OECD countries, the variation is wide. Several smaller northern European democracies record materially higher levels on the same measure.10 These are not societies that have somehow escaped the structural conditions of modern complexity. They face the same fragmented governance, the same global pressures, the same fiscal constraints, and the same demographic challenges. What separates them from the UK is not the absence of consent-control problems but the way their institutions handle the gap. This is the subject of Section 3.
The relevant point for present purposes is that the British level of distrust is not simply downstream of conditions that affect all advanced democracies equally. It is an outlier even by the standards of countries with similar economic and political structures.
2.3 The Voice Gap
A common reading of trust decline treats it as essentially affective: a mood, a vibe, a media-fed disposition, a generational shift toward cynicism, or a contagion of disaffection driven by social media. Some of this is undoubtedly present. But the OECD survey offers a more analytically useful finding, one that maps directly onto the consent-control framework.
The OECD asked respondents whether they felt they had a say in what government does. Across OECD countries, an average of 30 per cent answered yes. In the UK, the figure was 20 per cent.11 More importantly, the OECD then disaggregated trust in national government by this same question. Among people who felt they had a say, 69 per cent reported high or moderately high trust in their national government. Among those who felt they did not, the figure was 22 per cent.12
That is a 47-percentage-point gap in trust associated with a single perceptual variable: whether citizens feel the system listens. It is larger than the gap between trust levels in Switzerland and Slovakia. It is larger than the gap associated with income, age, gender, or education.
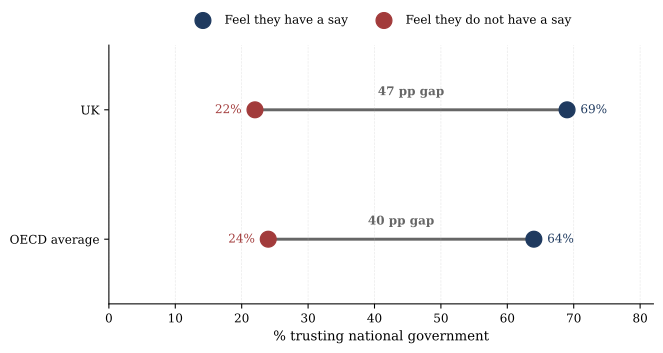
This finding does not, on its own, prove a causal direction. People who have already lost trust may be more likely to report feeling voiceless, just as those who feel voiceless may be more likely to lose trust. But it does establish something important: in the OECD’s data, the question of whether citizens experience their political system as responsive is the single largest discriminator of trust in that system, larger than any standard demographic or economic variable. This is not the consent-control gap measured directly, but it is one of the closest available survey proxies for it: whether citizens experience the political system as responsive to their input.
2.4 Belief Under Repeated Evidence
Once the structural pattern is in view, the dominant interpretations of British trust decline become harder to sustain.
The affective reading treats trust decline as a kind of bad mood, often attributed to media coverage, social media polarisation, or generational disposition. There is no doubt that media systems and online discourse shape political perception. But the affective reading struggles to explain why trust decline is strongly associated with perceived voice in ways that affective or purely partisan accounts do not predict - and it struggles to explain why the decline has been sustained, long-running, and recurrent across changes of media environment and political leadership.
The partisan reading treats trust decline as an artefact of unpopular governments: people lose trust when their preferred party is out of power. But the BSA trend question explicitly asks about governments in general, and the trajectory has continued through changes of governing party. The 2024 election produced a major shift in parliamentary composition - Labour won 411 of 650 seats, around 63 per cent of the Commons, on 33.7 per cent of the vote.13 In its immediate aftermath, the BSA found that public satisfaction with the system of governing remained near record lows.14 The same release recorded that approximately 79 per cent of respondents said the system of governing Britain needed “quite a lot” or “a great deal” of improvement, with only around 19 per cent saying it needed only small improvements or no improvement at all.15 This is system-level dissatisfaction, not partisan dissatisfaction. If the decline were primarily partisan, this would be a hard outcome to explain.
The populist contagion reading treats trust decline as evidence of public capture by demagogues and misinformation. This too has some empirical basis, but it tends to reverse the causal arrow: trust decline precedes populist surges historically, not the other way around.16 Populist movements grow in the soil that distrust prepares; they do not, on the available evidence, produce that soil unaided.
Scandals and leadership failures matter too. The MPs’ expenses scandal, Brexit deadlock, Partygate, and repeated ethics controversies all damaged political trust. But these episodes are best understood as accelerants within a longer decline, not as sufficient explanations for the long-run pattern. The BSA series began falling well before the expenses scandal and continued falling under governments unconnected to it.
A more defensible reading is that trust decline is consistent with rational updating in a loose Bayesian sense: when people repeatedly see promises fail to become outcomes, they reduce their expectation that the next promise will become the next outcome. This is not nihilism. It is a calibrated response to observed delivery failure across multiple domains over multiple decades.
The framework does not require all citizens to be undertaking this calculation consciously. It requires only that, on aggregate, populations exposed to repeated mandate-delivery gaps lower their priors on the mandate-delivery relationship. This is the pattern the rest of the paper tests against specific policy domains: whether trust in political institutions falls where the visible relationship between mandate and outcome appears to weaken, both across time within the UK and across countries with different institutional architectures.
This reading has two important implications. First, trust decline is not the disease; it is the symptom. The disease is the structural mismatch between democratic authorisation and institutional action - the consent-control gap. Restoring trust without addressing the gap is therefore an attempt to treat the symptom while leaving the cause in place. Second, the reading frames trust decline as broadly responsive to evidence, rather than as a permanent affective drift. If the mandate-delivery relationship were repaired, the prediction would be that trust would, slowly and asymmetrically, recover.
2.5 The Modest Claim
This section has not argued that delivery failure causes trust decline in any strict sense. The causal arrows in trust data are notoriously hard to identify cleanly, and the responsible analytical claim is weaker than causation. What the section has established is that British trust decline is real, sustained over multiple decades, broadly distributed across institutions and measurement traditions, internationally distinctive even within Europe, and most strongly associated with perceived political voice rather than with media exposure, partisan alignment, or demographic variables.
These features are consistent with the consent-control gap operating as one underlying generator. They are difficult to reconcile with affective, partisan, or populist-contagion readings considered in isolation. And they suggest that the central British political problem is not what voters feel about their politicians, but what voters experience about the relationship between authorisation and outcome.
Trust, on this reading, is not just a measurement of feeling. It is the running estimate citizens keep of whether the institutions that ask for their consent are the same institutions that can produce results. In Britain, those two things have become, in increasingly visible ways, separate.
That experience is the subject of the rest of the paper.
3. Institutional Design Moderates the Gap
If the consent-control gap were a generic feature of modernity, it would express itself identically across advanced democracies. It does not. The trust data already established in Section 2 - the UK at 27 per cent against an OECD average of 39 - is the first hint that institutional architecture shapes the gap in ways that distinguish national outcomes. This section develops that observation into a structural argument.
The claim is not that any country has solved the consent-control gap. Every advanced state operates under conditions of distributed institutional power, asymmetric information, weak feedback loops, and a rhetorical inheritance designed for simpler governance. The gap exists everywhere. What varies is its shape.
3.1 The Variables That Matter
Three institutional-design variables appear to control the shape of the gap across advanced democracies.
The first is the distance from citizen to decision-maker: how many institutional layers separate the voter from the actor who actually decides. Short distances make the mandate-machinery relationship traceable. Long distances make it abstract. This is partly about formal decentralisation, but more fundamentally about where genuine decision-making competence sits.
The second is the visibility of constraints: when the system blocks itself, whether the block is observable. Some democracies have explicit veto points written into their constitutions, legible to any voter who follows politics. Others have implicit veto points buried in administrative procedure, statutory consultation, or judicial review, where blocks happen but cannot easily be attributed.
The third is delivery responsiveness: whether the system, having received a mandate, can be observed to deliver against it within a timeframe that voters can track. This is partly about state capacity in the technical sense, but more particularly about whether delivery becomes visible at the level citizens experience.
Britain scores poorly on all three. The five comparators that follow are not arranged as candidates for emulation. They are arranged to show, on each variable, how institutional design produces different shapes of the same underlying problem.

3.2 Narrower Gaps: Denmark’s Local Settlement
Denmark is the most-cited Nordic case in this literature for two reasons. Its trust levels remain materially higher than the UK’s by every comparable measure - 44 per cent on the OECD 2024 high/moderately high scale, against the UK’s 27.17 And its institutional architecture is structurally distinctive: Denmark is not a federation, but it often functions as a highly municipalised state - a lean national centre sitting above unusually powerful local government.
Subnational government in Denmark accounts for approximately 64 per cent of total public expenditure - the highest share in the OECD, and several times the equivalent share in the UK.18 Municipalities deliver the majority of services Danish citizens routinely encounter: schools, eldercare, childcare, primary social services, local infrastructure, much of local economic policy. Mayors are recognised. Council decisions are reported in local media that still exists in functional form. The route from a voter’s concern to the institution that actually decides what to do about it is short, named, and observable.
This does not mean Denmark is free of fragmentation. Danish governance involves the same EU-level constraints, the same global market exposure, the same technical regulators, and the same long delivery chains for major infrastructure as any advanced European state. The gap exists. But it is narrower because the average citizen has institutional access to the level at which a meaningful share of decisions actually happens.
The implication for Britain is precise. Denmark does not show that decentralisation is intrinsically virtuous; it shows that the distance from citizen to decision-maker is one of the variables that controls the gap. Britain has chosen the opposite end of this variable: among the most centralised states in the OECD, with local government stripped of independent fiscal capacity over four decades, delivering a shrinking share of services from authorities most voters cannot name. The Danish settlement is not a model to copy. It is evidence that the British settlement is a choice, not a destiny.
3.3 More Legible Gaps: Germany’s Visible Vetoes
Germany is the comparator closest to Britain in scale, economic structure, and democratic seriousness. It is also a useful case for the opposite variable. Germany has more formal veto points than Britain, and many of them are constitutionally entrenched. Its delivery is in many respects slower. And yet German trust levels remain higher and its political instability lower.
The difference is visibility.
Germany’s veto points are explicit, political, and constitutional. The Bundesrat formally represents the Länder in federal lawmaking. The Federal Constitutional Court can and does block legislation. The Länder retain substantial autonomous competence over education, policing, and large parts of administration. When the German system blocks itself - and it blocks itself often - the block is a political event. A Land government has objected; a constitutional review has been initiated; a coalition negotiation has stalled. The institution responsible has a name, a leader, and a reason. The disagreement is forced into the open, where it can be reported on, contested, and ultimately resolved through visible political horse-trading.
Britain’s veto points are implicit, procedural, and bureaucratic. A development is blocked by statutory consultee objection, by judicial review on procedural grounds, by a regulator’s interpretation of its remit, by a planning committee overruling officer recommendations, by a Treasury rule change buried in a fiscal statement, or by an arms-length body acting within delegated authority. Each of these is, in some sense, accountable. None is observable in the way a Bundesrat block is observable. In Germany, a block is a political choice. In Britain, a block is an administrative accident.
The result is that Germany’s consent-control gap is wide in some places but legible. Voters can locate the constraint. They may not agree with it. They may want to change the constitution that produces it. But they can see it. Britain’s gap is fogged. The constraint exists, often binds, and rarely shows itself to the voter trying to understand why nothing is changing. Capacity rises; visibility falls.
3.4 Centralisation Without Capacity: France
France is the closest structural analog to Britain among large European democracies. It is centralised, has a strong executive, and possesses the formal apparatus of a unified national state with planning competence. Its prefectural system is famously top-down. Its political culture, like Britain’s, expects the state to act.
The differences matter.
France retains, despite four decades of erosion, a more substantial technocratic apparatus than Britain. Its grandes écoles continue to supply administrative talent at scale. Its state still builds rail. Its public infrastructure - measured in operational capacity, not aspirational target - remains delivered. Centralisation in France produces, on most contemporary measures, more than centralisation in Britain.
The instructive case is what happens when this capacity erodes. The gilets jaunes movement that erupted in 2018, ostensibly over a fuel tax but in substance over a broader sense of state remoteness, illustrates the failure mode of centralised states whose capacity has begun to slip. The protest was not a demand for decentralisation. It was a demand that the centre actually deliver something visible to people outside the metropolitan core. Macron’s subsequent grand débat - a national consultation exercise unprecedented in modern French politics - was an attempt to repair perceived responsiveness without restructuring the system.
France shows one way centralisation can remain politically viable: not because citizens love being governed from the centre, but because the centre retains enough administrative and infrastructural capacity to make itself visible in daily life. Britain has retained the expectation of central command while allowing much of the machinery of command to atrophy. The failure mode of this configuration is not passivity. It is intermittent revolt against a system that has stopped delivering. France shows what that revolt looks like when it arrives.
3.5 Fragmentation as Warning: The United States
The United States is the comparator least useful for direct emulation and most useful as a warning. Its constitutional structure is too different from Britain’s to support fine-grained institutional comparison. But on the consent-control variables, the American pattern illuminates a different failure mode that converges on similar outcomes.
The US has more veto points than any other major democracy: bicameral legislature, filibuster, federalism, judicial review, executive orders, independent agencies, and a fifty-state administrative landscape. Delivery on housing, infrastructure, healthcare, and basic public services is - in much of the country - chronically poor. Trust in national government, by the same OECD methodology, sits near the UK’s level.19
The analytical point is that American fragmentation produces, by a different route, outcomes recognisable to British observers. Where Britain has executive concentration without delivery, the US has institutional dispersion without coordination. Both produce visible mandate-delivery gaps, sustained trust decline, and the rising salience of populist movements promising to break the system to make it respond. The American case is not a model. It is the warning that Britain is closer to than its self-image acknowledges.
3.6 The Hardest Case: Perceived Responsiveness Without Democracy
The most analytically valuable comparator is also the most politically uncomfortable. The Democracy Perception Index, produced annually by the Alliance of Democracies Foundation in partnership with Latana, has for several years recorded consistently high responses from Chinese citizens on questions about democratic responsiveness. In recent waves, around 75 to 80 per cent of Chinese respondents have described their country as democratic; over 90 per cent have said their government serves the interests of most people.20 Comparable UK and US figures on the latter question typically range between 30 and 40 per cent.
These figures should not be read naively. Survey responses in authoritarian contexts are shaped by information control, political culture, social desirability, and fear, even under anonymous methodologies. The point of citing them is not to validate Chinese governance, which is not democratic in any institutional sense the term usually carries. It is to identify an analytical distinction that the consent-control framework needs.
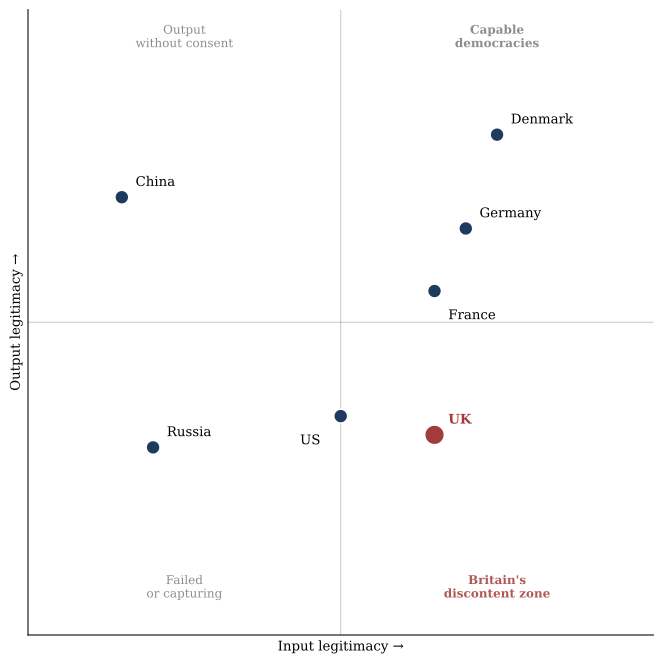
The German political scientist Fritz Scharpf drew a useful contrast between two sources of democratic legitimacy: input legitimacy (government by the people, expressed through votes, participation, and procedural rights) and output legitimacy (government for the people, expressed through delivered outcomes - safety, infrastructure, basic public goods).21 These two sources can reinforce one another in healthy democracies. They can also drift apart.
The Chinese case is the pathological extreme of one such drift. With essentially zero formal input legitimacy by Western definitions, the Chinese state has maintained substantial domestic stability through sustained, visible output delivery: rapid infrastructure construction, large-scale urban development, observable rises in material standards, and basic state competence at the level of routine encounter. The DPI data suggests that, at the level of subjective experience, this output delivery registers as a form of responsiveness. This is not a defence of the system that produces it. It is an observation about how citizens process state performance.
The Russia comparison reinforces the analytical point. Russian DPI figures on equivalent questions have declined materially since 2022, despite arguably similar levels of authoritarian constraint on response. This suggests that the high Chinese figures should not be dismissed only as artefacts of fear or compliance; the surveys appear to track something closer to a population’s transactional assessment of state competence.
For Britain, the implication is not flattering. The British state currently combines high input legitimacy - regular free elections, peaceful transfers of power, a credible electoral system in formal terms - with deteriorating output legitimacy. Voters can authorise governments but increasingly cannot observe those governments deliver. The result is one of the most corrosive configurations available to a democracy: the demands and rituals of input legitimacy operating without the reinforcing experience of output. Input without output erodes consent over time. Output without input represses it. Britain has the first problem.
3.7 Britain in the Comparative Frame
The five comparators are not arranged to suggest that any of them is the answer. They are arranged to locate Britain on the three institutional-design variables that control the gap.
On the distance from citizen to decision-maker, Britain sits at the long-distance end alongside France, with Denmark at the short-distance end and Germany distributed across multiple federal levels. Britain’s distance is the result of forty years of fiscal centralisation and the steady erosion of independent local capacity.
On the visibility of constraints, Britain sits near the bottom. Where Germany’s vetoes are constitutional and political, and the US’s are at least formally visible, Britain’s are largely administrative, procedural, and statutory. Voters can rarely identify the institution that has stopped a thing from happening.
On delivery responsiveness, Britain has slipped from a level that supported high trust into one that does not. The exact mechanisms are the subject of Section 4. The comparative point is that France retains more delivery capacity than Britain despite similar centralisation; Denmark sustains delivery through devolved competence; Germany delivers visibly through legible federal disagreement. Britain has chosen executive concentration without the apparatus to make it function, and procedural opacity without the political theatre that makes opacity contestable.
The result is not that Britain has been singled out by complexity. It is that Britain has accumulated, through successive institutional choices, one of the least favourable configurations on each of the three variables that matter. The comparative frame shows that the consent-control gap can be narrowed, made legible, or sustained against ordinary erosion. The British settlement does none of these.
A clarification is worth making before the next section. The comparators in this section are used to illustrate institutional variables, not as templates for direct transfer. Some of the advantages enjoyed by countries like Denmark are not purely architectural: smaller scale, higher social trust, more historically homogeneous populations, and different fiscal traditions all contribute to outcomes in ways that British reform cannot straightforwardly import. The argument is not that Britain should become Denmark, or Germany, or France. It is that the British configuration sits at the unhelpful end of variables the paper has shown are responsive to institutional design, and that other paths through the same variables exist. That is the case Section 4 develops in detail.
4. Four Machinery Maps
The remainder of this paper applies the consent-control framework to four policy domains: housing, the NHS, energy, and education. Each map runs through three steps: the mandate (what was promised, and by whom), the machinery (the institutional chain through which delivery passes), and the gap (where cause, observe, and judge break down). The section closes with a cross-sector matrix comparing all four domains.
The four domains are chosen for analytical, not rhetorical, reasons. Together they expose four different mechanisms by which the consent-control gap operates. Housing illustrates a national mandate executed through localised, market-mediated delivery. The NHS illustrates a sacred institution voters feel they own but cannot see inside. Energy illustrates a national strategy exposed to global markets and infrastructure networks no election directly controls. Education illustrates a generational ambition delivered through institutions that work on timescales no electoral cycle can match.
Three patterns are visible across all four maps before any detail is examined.
First, every domain has a national mandate but sub-national, supra-national, or private delivery. Second, every domain has a long lag between intervention and visible outcome. Third, every domain has a fragmentation marker - a count of institutions in the delivery chain that exceeds what most voters can name, much less hold to account.
These patterns are the analytical spine of the section. Each map develops them through different evidence.
Each machinery map is a simplified institutional account, not an exhaustive analysis of the policy domain. The purpose is democratic legibility: to ask whether an ordinary voter can plausibly trace responsibility for an outcome through the chain of institutions that produces it. The maps therefore focus on which actors hold genuine decision-making competence, where the mandate disperses, and where attribution becomes obscure. They do not claim to settle the substantive policy debates within each domain - housing supply economics, NHS reform, energy market design, education accountability - all of which have substantial specialist literatures of their own. The argument here is about the architecture connecting consent to outcome, not about the merits of specific policy choices within each chain.
It is also worth saying at the outset that the institutional layers described in each map exist for reasons. Regulators, statutory consultees, professional bodies, independent commissioning bodies, and quasi-judicial procedures were each created to manage legal risk, technical complexity, equity considerations, or the limits of ministerial expertise. The argument is not that these layers should be abolished. It is that the architecture connecting them to democratic mandate has become decoupled - that the institutional machinery, often well-designed for its individual functions, does not aggregate into a system the democratic principal can find, steer, observe, or judge.
4.1 Housing: The National Promise and the Local-Market Machine
Housing is the cleanest case for the consent-control framework because the promise is simple, the outcome is measurable, and the gap between them is reproducible across decades and across changes of government.
4.1.1 The Mandate
The contemporary numerical commitment to build 300,000 new homes a year in England can be traced to the 2004 Barker Review, which estimated the supply needed to keep house price growth in line with the European average.22 The Conservative government formally adopted it in the 2017 Autumn Budget as an ambition to be achieved by the mid-2020s, and reiterated it in the 2019 manifesto: “we will continue our progress towards our target of 300,000 homes a year by the mid-2020s. This will see us build at least a million more homes, of all tenures, over the next Parliament.”23 By May 2022, with delivery falling short, the Housing Secretary Michael Gove publicly distanced the government from the target, arguing it was wrong to be “bound by one criterion alone.”24 The 2024 Labour manifesto restored the same arithmetic in a different form: a commitment to deliver 1.5 million homes during the current parliament, which - if the parliament runs full term - again implies an average of 300,000 a year.25
The 300,000 figure has therefore been a stable national mandate, in different rhetorical packaging, for the better part of a decade. It has been politically owned by two parties, restated across multiple general elections, and reflected in successive policy documents. The numerical promise has been remarkably consistent.
The delivery has not.
The MHCLG series for net additional dwellings - the most comprehensive official measure of housing supply in England - shows the gap concretely. Net additions reached a post-2008 peak of 248,590 in 2019-20, then 217,750 in 2020-21, 234,290 in 2022-23, 221,070 in 2023-24, and 208,600 in 2024-25 - the third consecutive year of decline.26 The 300,000 target has not been met in any year since it was adopted. Independent demand estimates suggest the figure is itself low: a 2024 update of the Barker analysis suggested 385,000 a year was now required, and the National Housing Federation has cited Heriot-Watt research estimating around 340,000.27 Centre for Cities, using a different methodology, concludes that at the current target of 300,000 the backlog of missing homes accumulated since 1947 would take fifty years to close.28
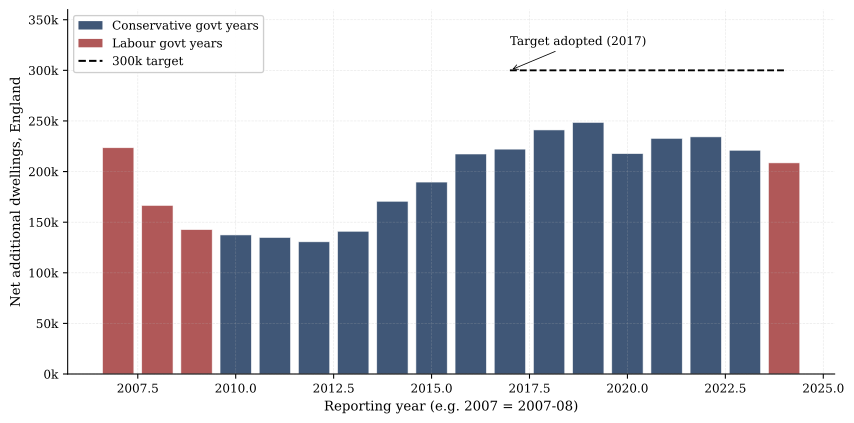
Two things are striking about this pattern. The first is that the mandate-delivery gap is structural, not partisan: it has held under different governments, different housing ministers, and different policy frameworks. The second is that the failure is durable in a way that points beyond the standard explanations of any single administration.
4.1.2 The Machinery
A government does not build houses. It adjusts a system that may or may not produce them.
The system contains, at minimum: central government (which sets national targets and policy); the Treasury (which sets fiscal constraints and tax treatment of property); the Ministry of Housing, Communities and Local Government (which writes the National Planning Policy Framework); the Planning Inspectorate (which adjudicates appeals); 296 local planning authorities (which receive and determine applications); planning committees within those authorities (which can and do override officer recommendations); statutory consultees including the Environment Agency, Natural England, Historic England, and National Highways (which must be consulted and can object); water companies and other infrastructure providers (whose capacity constraints shape what can be built where); private developers ranging from the largest housebuilders to SME builders (who decide what to apply for, where, and on what timeline); landowners (who decide when to release land); the construction labour market (cyclical, ageing, post-Brexit constrained); the construction materials supply chain (internationally exposed); interest rates and mortgage availability (which determine demand-side capacity); and finally local political dynamics (which determine what is politically possible in a given ward).
No serious description of the machinery contains fewer than a dozen institutions. Most contain more. Few voters could name half of them.
The Lichfields Start to Finish series, an evidence base now drawing on 297 sites delivering a combined 387,000 dwellings, is the most comprehensive empirical account of how long this machinery takes to produce homes. Smaller sites of under 100 units typically deliver their first home within five years of the first planning application. Sites of 500 dwellings or more take more than five years just in the planning and pre-commencement phases. Earlier versions of the series found that sites of 2,000 dwellings or more averaged eight years from initial planning application to first home delivered.29 These are the sites local authorities most rely on to meet their housing requirements; they are also the sites whose timeline is least visible to voters and least responsive to short-term political intervention.
The Home Builders Federation’s Planning on Empty analysis adds a complementary fact about the front end of the machinery. Just 19-20 per cent of major planning applications are determined within the statutory 13-week period. Between July 2022 and June 2024, roughly a third of councils determined zero major applications within that statutory deadline. Eighty per cent of councils were operating below full planning department staffing capacity, and HBF estimates an additional 2,200 planning officers are needed nationally to meet projected demand - against a government commitment to fund 300.30 Government statistics also publish a “13-week or agreed extended period” measure, against which performance is much higher; the distinction matters because it captures the cost of routine extensions that the headline figure conceals.
4.1.3 The Gap
Cause - the mandate disperses. A national commitment to 300,000 homes passes from the executive to the Treasury, the Department, the planning framework, 296 local authorities, planning committees, statutory consultees, developers, landowners, infrastructure providers, the labour market, and interest rates. At each handoff, the mandate loses force. The result is not that the executive lacks the will to build; it is that the executive’s will is necessary but nowhere near sufficient. The mandate exists in language at the national level and in fragments at every level beneath.
Observe - the chain becomes illegible. When a voter notices that nothing is being built in their area, they cannot easily tell whether the cause is a stalled local plan, an environmental objection by Natural England, a water-company capacity constraint, a developer waiting for an interest-rate cut, an under-resourced planning department, a planning committee overruling officer recommendations, a five-year process to discharge planning conditions on a major site, or a strategic land bank held in anticipation of price recovery. Any of these can produce the same observable outcome: nothing being built. None is easily attributable from outside the system. The civic infrastructure that might once have rendered the chain legible - local newspapers covering planning committees, council reporters tracking statutory consultee objections, civic associations versed in the local plan - has contracted sharply over the same period. The institutional density of the system has grown; the civic capacity to interpret it has not.
Judge - attribution becomes circular. Central government blames councils for not approving applications; councils blame central government for underfunding planning departments and imposing unrealistic targets; developers blame planning delays and section-106 obligations; residents blame developers, councils, and central government in some combination determined by local politics. None of these attributions is wholly wrong. Each captures part of a delivery chain in which responsibility is genuinely shared. But shared responsibility, in a chain this fragmented, is functionally equivalent to no responsibility - and that is how voters experience it.
The longer-run pattern reinforces the point. Centre for Cities’ work on housebuilding rates since 1856 shows that, after the Town and Country Planning Act of 1947 introduced the discretionary case-by-case permission system that still governs English planning, the housebuilding rate fell from 1.9 per cent annual growth (1856-1939) to 1.2 per cent (1947-2019).31 The shortfall has accumulated over generations: Britain had 5 per cent more dwellings per person than the European average in 1955; by 2015 it had 8 per cent fewer. The discretionary planning system is not the sole cause of the housing shortage. But it is the institutional pivot at which the national mandate to build more homes meets the local machinery that determines whether they are built.
Table 4.1: Housing machinery map — headline data
| Dimension | Evidence |
|---|---|
| Mandate | 300,000 homes/year by mid-2020s (Conservative 2017-2022); 1.5m over parliament (Labour 2024) |
| Outcome | Net additional dwellings, England 2024-25: 208,600 (third consecutive year of decline). Target never met since adoption. |
| Independent need estimate | 340,000-385,000/year; ~4.3m accumulated backlog at current target would take 50+ years to clear |
| Machinery scale | Central government + Treasury + MHCLG + 296 LPAs + planning committees + statutory consultees + developers + landowners + infrastructure providers + interest rates + labour market |
| Cause break | National mandate disperses through every layer below it |
| Observe break | Same observed outcome (delay) consistent with many institutional causes |
| Judge break | Attribution circulates between government, councils, developers, regulators, residents |
| Time horizon | 5+ years from first application to first home on sites of 500 units; ~8 years for largest sites |
| Front-end signal | Only ~20 per cent of major applications determined within statutory 13-week period; one-third of councils met zero within deadline (2022-2024) |
Housing shows the consent-control gap at its most concrete: voters can authorise more homes nationally, but the machinery that produces homes is localised, market-mediated, procedurally dense, and structurally resistant to simple command. The national promise is simple. The institutional pathway is not. Eight years on the largest sites is not a failure of will. It is the time the system takes.
4.2 The NHS: Sacred Ownership, Invisible Delivery
If housing is the cleanest case for the consent-control framework, the NHS is the most politically loaded. It is the institution British voters most strongly identify with, most closely defend, and most often invoke as the test of any government’s competence. It is also one of the most fragmented delivery systems in British public life. The combination produces the consent-control gap in its most charged form: ownership without visibility.
4.2.1 The Mandate
No British political party has, in living memory, run on a manifesto promising less NHS. The political contract is bipartisan and durable: the National Health Service will remain free at the point of use, comprehensive in coverage, and protected from the privatisation it is routinely accused of facing. To this baseline commitment, successive governments have added more specific operational promises - waiting time standards, access targets, workforce expansion plans, technological modernisation.
The most operationally specific of these mandates is the NHS Constitution’s commitment that 92 per cent of patients should begin consultant-led treatment within 18 weeks of referral. This is the central elective waiting-time standard. The right to begin consultant-led treatment within 18 weeks has been part of the NHS Constitution since 2010, and the 92 per cent operational threshold has been a statutory requirement since 2012; the standard has remained in force continuously since, including through the long period in which it has gone unmet.32 What has changed is not the standard but the date by which government promises to meet it again: the current government has committed to achieving it by March 2029, with interim milestones of 65 per cent by March 2026 and 70 per cent by March 2027.33 Other operational standards apply to A&E waits, cancer treatment, ambulance response, and primary care access.
The mandate, in other words, is unusually clear by British political standards. It is not “improve the NHS” in some general sense. It is a set of named numerical commitments backed by both statute (the NHS Constitution) and repeated ministerial restatement. The political ownership is total. Every Prime Minister of the past two decades has made personal investment in NHS performance a central plank of their domestic political identity.
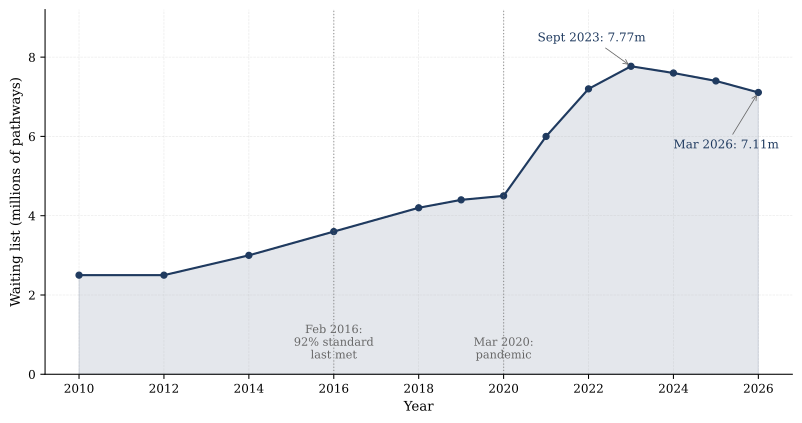
The delivery has weakened. The full 92 per cent 18-week standard was last met in February 2016, and has not been met as a national whole since.34 Performance against interim targets has improved: the March 2026 staging milestone of 65 per cent was met, with 65.3 per cent of patients beginning treatment within 18 weeks of referral. But the full 92 per cent constitutional standard remains substantially unmet, and the target date for meeting it again now sits at March 2029. The elective waiting list rose from approximately 4.4 million pathways in March 2019, with a median wait of 6.9 weeks, to a peak of approximately 7.77 million in September 2023.35 The most recent figures record approximately 7.11 million pathways on the list, of which around 2.47 million have been waiting longer than 18 weeks, and approximately 94,000 longer than a year. The median wait is now around 11.3 weeks, near twice the pre-pandemic level.36 These are not the consequences of any single policy decision. They are the operational state of a system that has, for nearly a decade, not met its own central legal commitment to its patients.
4.2.2 The Machinery
If housing illustrates a mandate dispersed across markets, the NHS illustrates a mandate dispersed across an institutional system of comparable density.
The machinery contains, at minimum: the Treasury (which sets multi-year spending envelopes and capital settlements); the Department of Health and Social Care (which holds nominal national responsibility); NHS England (the operationally responsible commissioning body, currently in the process of being reincorporated into DHSC); 42 Integrated Care Boards (which commission services regionally); more than 200 NHS trusts and foundation trusts (which deliver hospital and mental health services); thousands of independent GP partnerships (the primary point of contact for most patients, structured as small businesses with NHS contracts); the adult social care system (run by 153 upper-tier local authorities and a large private provider market); the workforce pipeline (medical schools, nursing schools, the GMC, NMC, royal colleges, and immigration policy, which together determine who is available to staff the service); the NHS estate (capital programmes, maintenance backlog, individual trust finances); procurement (NHS Supply Chain, pharmaceutical companies, medical device suppliers); and public health (now distributed across DHSC, the UK Health Security Agency, the Office for Health Improvement and Disparities, and local authorities).
Few voters could name half of this list. Few politicians could. The machinery is genuinely opaque in a way the housing system is not - because where the housing system is fragmented across visible boundaries (Whitehall, council, developer, regulator), the NHS is fragmented across nested institutions that share the same brand. To the patient on a waiting list, “the NHS” is one thing. To the system delivering their care, it is many.
The workforce arithmetic illustrates the durability of the problem. The total NHS workforce in England in 2025 was approximately 1.37 million full-time equivalent staff, with around 100,000 vacancies open at any given time.37 Between 2010 and 2025, the number of doctors increased by approximately 54 per cent, nurses by 31 per cent, and allied health professionals by 45 per cent. Over the same period, the number of managers increased by approximately 6 per cent. The maintenance backlog on the NHS estate - the cost of repairs and renewals that have been deferred - has risen from £5.4 billion in 2013/14 to approximately £13.8 billion in 2024, with the share classified as “high risk” growing several-fold over the same period.38 Aggregate UK health spending sits within the broad range of comparable European systems on some measures and below several of them on others; the diagnosis here is not that funding is uniformly adequate or inadequate, but that decisions made and deferred at multiple points in a fragmented institutional system cannot be reached directly by a single political mandate, regardless of the headline spending envelope.
One specific feature of British health administration distinguishes it from European peers. UK administrative spending sits at roughly 1.9 per cent of total health spending, compared with 4.4 per cent in Germany, 5.5 per cent in France, and 3.7 per cent in the Netherlands.39 This is sometimes cited as evidence of British administrative efficiency. It can equally be read as evidence of administrative undercapacity in a system whose institutional density has grown faster than its management apparatus. In either case, the implication for the consent-control gap is the same: the institutions voters most identify with the political mandate are not the institutions that deliver against it.
4.2.3 The Gap
Cause - the mandate disperses. A national commitment to restore waiting time standards passes from the Prime Minister to the Health Secretary, then to the Treasury (which determines spending), DHSC and NHS England (which set commissioning priorities), 42 ICBs (which translate priorities into regional plans), individual trusts (which manage capacity, workforce, and discharge), GP practices (which control referral patterns), social care providers and local authorities (whose performance determines whether discharged patients can leave hospital beds), medical and nursing training pipelines (which determine workforce supply five to ten years downstream), and the immigration system (which determines short-term workforce availability). At each handoff, the mandate competes with other commitments operating at the same point. The Prime Minister can announce a waiting list target. Whether the target is met depends on whether the social care provider can collect the elderly patient from a hospital bed they are no longer medically obliged to occupy.
Observe - the chain becomes illegible. When a voter sees that their hospital is overcrowded, or their relative has been on a waiting list for fifteen months, they cannot easily tell whether the cause is workforce shortage, capital underinvestment in operating theatres, primary care access weakness pushing demand into A&E, social care discharge bottlenecks, demographic pressure beyond any system’s capacity, COVID-era backlog still working through, productivity decline whose causes are themselves disputed, or recent national policy decisions whose consequences have not yet arrived. Any of these can produce the same observable outcome. The patient experience is identical regardless of which institutional layer is failing. The abolition of Community Health Councils in 2003, and their replacement by a succession of less institutionally embedded patient-involvement bodies, weakened one route through which local NHS decisions had once been subject to sustained lay scrutiny.40
Judge - attribution becomes circular. The government blames NHS England for operational underperformance and the pace of reform. NHS England points to Treasury settlements as insufficient to meet rising demand. Trusts point to workforce shortages and social care bottlenecks they do not control. Social care providers point to local authority funding settlements set by central government. Royal colleges and unions point to staff conditions and pay. The Treasury observes, accurately, that health and social care spending consumes a substantially larger share of all departmental spending than it did a generation ago - and asks where the additional money has gone.41 None of these positions is wholly wrong; each captures part of a delivery chain in which responsibility is genuinely shared. As with housing, shared responsibility in a chain this fragmented is functionally equivalent to no responsibility - and that is how voters experience it. In the most recent British Social Attitudes survey, public satisfaction with the NHS was 21 per cent, the lowest level recorded since the survey began in 1983.42
Table 4.2: NHS machinery map — headline data
| Dimension | Evidence |
|---|---|
| Mandate | 92% of patients to begin treatment within 18 weeks (NHS Constitution); restored target March 2029 |
| Outcome | Standard last met February 2016. Waiting list: 4.4m (March 2019) → 7.77m (September 2023) → ~7.11m (latest). 2.47m waiting >18 weeks; ~94,000 waiting >1 year. |
| Machinery scale | Treasury + DHSC + NHS England + 42 ICBs + 200+ trusts + thousands of GP partnerships + adult social care system (153 LAs + private providers) + workforce pipeline + estate + procurement + public health |
| Cause break | National mandate disperses across nested institutions sharing the NHS brand |
| Observe break | Same observable outcome (long wait) consistent with many institutional causes |
| Judge break | Attribution circulates between government, NHS England, Treasury, trusts, social care, workforce pipelines |
| Workforce | ~100,000 vacancies; managers grew ~6% (2010-25) while doctors grew 54%, nurses 31%, allied health 45% |
| Estate | Maintenance backlog ~£13.8bn (2024), more than doubled since 2013/14 |
| Satisfaction | 21% (BSA 2024), lowest since the survey began in 1983 |
The NHS shows the consent-control gap in a system voters feel they own but cannot see inside. The mandate is clear, durable, and unusually well-specified by British political standards. The machinery is one of the most institutionally dense in British public life. The two are connected by a chain so internally distributed that no single political actor commands it, and no single voter can identify which institutional layer is responsible for the symptoms they experience. Britain has built one of the most ambitious public service institutions in the world and lost the ability to govern it through the only democratic mandate available to its citizens.
4.3 Energy: The National Strategy and the Global Machine
If housing illustrates a national mandate dispersed through local markets, and the NHS a sacred political ownership dispersed through nested institutions, energy illustrates the consent-control gap under conditions of global exposure. The mandate is national; the variables it tries to shape are partly outside national control. The British state has agreed legally binding targets to decarbonise the economy by 2050, deliver clean power generation by 2030, and keep bills affordable and supply secure throughout. The institutions that determine whether any of this happens are distributed across markets, regulators, infrastructure operators, planning systems, and physical networks that no election directly commands.
4.3.1 The Mandate
The energy mandate has three layers, often conflated in political rhetoric. The first is affordability: bills should be low or, at minimum, predictable. The second is security: the lights should stay on, heating should work, supply should not depend on the goodwill of hostile states. The third is decarbonisation: the economy should reach net zero by 2050, a target now established in primary legislation through the Climate Change Act 2008 (as amended in 2019), with intermediate carbon budgets advised by the Climate Change Committee.43 To this has been added, since 2024, a more specific operational commitment: Clean Power 2030, an ambition to deliver approximately 132 gigawatts of renewable and low-carbon generation capacity by the end of the decade.44
These three layers can be made to align in political rhetoric. The phrase “cheaper, cleaner, more secure” appears across recent manifestos in different rhetorical packaging. The operational reality is that they require different things at different timescales and from different institutions. Decarbonisation requires capital investment over decades. Affordability is affected by global gas prices on a monthly basis. Security depends on the interaction of pipeline politics, LNG markets, domestic generation reserves, interconnection with European neighbours, and the resilience of a grid built for a generation of stable demand. A government can promise all three. A government cannot command the variables that determine any of them.
The bills side of the mandate is where the gap has been most publicly visible. The Ofgem default tariff cap, introduced in January 2019, began at £1,137 a year for typical dual-fuel consumption.45 The cap rose by approximately 54 per cent in April 2022 and a further 27 per cent in October 2022 (a rise partially absorbed at the household level by the temporary Energy Price Guarantee). By April 2026 it stood at approximately £1,641, around 35 per cent above the pre-crisis cap level - a gap that has been broadly sustained for four years.46 No government from 2022 onwards has been able to return bills to pre-crisis norms, because the variable that primarily drives them - the wholesale gas price - is set by international markets the UK government does not control. The structural fact behind this is the marginal pricing system: in most settlement periods, the price of electricity is set by the most expensive generator required to meet demand, which in Britain is usually a gas-fired plant. This means UK electricity prices move with global gas prices regardless of the share of generation actually delivered by renewables.47
4.3.2 The Machinery
The institutional chain through which the energy mandate must travel is unusually long and unusually exposed to external variables.
The machinery contains, at minimum: the Department for Energy Security and Net Zero (DESNZ) (which sets policy direction); the Treasury (which structures subsidy regimes, sets levy frameworks, and underwrites major capital programmes); Ofgem (the economic regulator, which sets the price cap and approves network charges); the National Energy System Operator (NESO, recently brought into public ownership) (which operates the electricity system, runs balancing markets, and manages grid connection queues); National Grid plc (the private transmission asset owner for England and Wales); regional Distribution Network Operators (private regional monopolies managing lower-voltage distribution); hundreds of generators ranging from major utilities to community-scale solar developers (which decide what to build, where, and when); storage operators (an increasingly important category); retail suppliers (the firms that bill consumers); the planning system (LPAs, the Planning Inspectorate, the Nationally Significant Infrastructure Project regime for major projects); statutory consultees (Environment Agency, Natural England, Historic England, MoD on aviation, others); local communities (whose objections can produce judicial reviews and substantial delay); the Climate Change Committee (the statutory advisory body that publishes carbon budgets); the UK Emissions Trading Scheme (which sets the carbon price for industry); international interconnectors with France, Norway, the Netherlands, Belgium, and Ireland; the global LNG and pipeline gas markets; and the international capital markets, whose willingness to finance British renewables projects determines whether the headline targets can be met.
No mature description of British energy policy contains fewer than fifteen institutions and external variables. Most contain more.
The most concrete illustration of how this machinery has dispersed mandate from outcome is the grid connection queue. By 2024, projects representing more than 700 gigawatts of generation, storage, and demand were stuck in the queue waiting for a connection date.48 This was around four times the total capacity Britain needs by 2030 under any plausible decarbonisation pathway. The queue had grown roughly tenfold in five years. Shovel-ready projects - sites with planning permission, financing, and equipment supply secured - waited up to a decade for a confirmed connection date. In January 2025, NESO paused new transmission queue applications pending fundamental reform of how the queue was governed. The Connections Reform process, concluded in December 2025, prioritised approximately 283 gigawatts of projects for accelerated connection, with 132 gigawatts aligned to the Clean Power 2030 target and 151 gigawatts staged for 2035.49 Whether this reform delivers in practice is now the question; its necessity, after years of queue dysfunction, is the relevant evidence here.
The demand side of the grid is moving as rapidly as the supply side. Between November 2024 and June 2025, the transmission demand queue rose from approximately 17 gigawatts to approximately 97 gigawatts, driven principally by data centres and the early stages of electrification of heat and transport.50 No British government chose this surge in any direct sense. It arrived through the global compute economy, AI infrastructure investment, and policy decisions on electrification that span multiple parliaments. The mandate to deliver Clean Power 2030 is now a mandate to deliver against a moving target whose growth rate is shaped substantially outside the energy ministry.
4.3.3 The Gap
Cause - the mandate disperses. A national commitment to net zero, clean power, secure supply, and affordable bills passes from the Prime Minister to DESNZ, the Treasury, Ofgem, NESO, network operators, generators, suppliers, planners, statutory consultees, local communities, capital markets, and global gas markets. Each step contains genuine agency. None of them is fully commanded by the mandate at the top of the chain. A government can legislate net zero. It cannot command the marginal price of LNG. It can fund Contracts for Difference auctions. It cannot make the grid connection queue move faster than the institutional reform of the queue allows. It can announce a Clean Power 2030 target. It cannot, on its own, build a turbine.
Observe - the chain becomes illegible. When household bills rise, voters cannot easily tell whether the cause is global gas prices, network charges, supplier margins, environmental levies, taxes, regulatory frameworks, generation capacity constraints, or all of these in combination. When a wind farm with planning permission still cannot generate power six years later, voters cannot tell whether the bottleneck is the grid connection queue, transmission build-out, network operator capital constraints, statutory consultee objections, judicial review, or the regulatory framework within which any of these is being managed. The observed outcome - higher bills, slower delivery - is identical regardless of which layer of the machinery is responsible. The civic intermediaries that might translate these technical decisions into household consequences - specialist journalism, consumer advocacy, local reporting, parliamentary scrutiny - are too thin to make the chain routinely legible.
Judge - attribution becomes circular. Government blames global gas markets and the legacy of previous administrations. Ofgem points to the regulatory framework set by Parliament. NESO points to decades of underinvestment in transmission. Network operators point to regulator-imposed constraints on capital spending. Generators point to planning delays and connection queues. Local communities point to perceived imposition by Westminster of infrastructure they did not authorise. International markets do not respond to British political accountability mechanisms at all. As with housing and the NHS, each position captures part of a delivery chain in which responsibility is genuinely shared - and the shared responsibility is, from a voter’s perspective, indistinguishable from no responsibility.
Table 4.3: Energy machinery map — headline data
| Dimension | Evidence |
|---|---|
| Mandate | Net Zero 2050 (Climate Change Act); Clean Power 2030 (~132 GW renewable capacity); affordability and security commitments |
| Outcome (bills) | Default cap £1,137 (Jan 2019) → £1,641 (April 2026), ~35% above pre-crisis cap level sustained for four years |
| Outcome (grid) | Peak grid connection queue exceeding 700 GW (2024), ~4x what Britain needs by 2030; some projects waited 10 years for a connection date |
| Machinery scale | DESNZ + Treasury + Ofgem + NESO + National Grid + DNOs + generators + suppliers + planning system + statutory consultees + CCC + UK ETS + interconnectors + global gas markets + capital markets |
| Cause break | Mandate disperses across markets, regulators, network operators, planners, capital markets, global gas |
| Observe break | Bill rise or project delay consistent with many institutional causes; voters cannot disaggregate |
| Judge break | Attribution circulates between government, Ofgem, NESO, network operators, generators, communities, global markets |
| Structural exposure | Gas-fired marginal pricing means UK electricity prices move with global gas regardless of renewable share |
| Demand surge | Transmission demand queue ~17 GW (Nov 2024) → ~97 GW (June 2025), driven by data centres and electrification |
| Reform response | NESO paused new applications (January 2025); Connections Reform prioritised 283 GW (December 2025) |
Energy is the case where the consent-control gap operates under the most explicit conditions of external exposure. Voters can authorise a national strategy. The variables that determine whether bills are affordable, supply is secure, and capacity is decarbonised on schedule are distributed across markets, infrastructure networks, regulatory bodies, planning regimes, and global forces that no British government can directly command. This is not an argument that energy policy is unimportant or that mandates do not matter. It is an argument that the mandate must be honest about what it is asking for - and that, where it cannot be honest, the gap between political promise and material outcome will continue to widen the consent-control problem the rest of the paper describes.
4.4 Education: Electoral Promises, Generational Outcomes
If housing illustrates a national mandate dispersed through local markets, the NHS a sacred ownership dispersed through nested institutions, and energy a national strategy exposed to global forces, education illustrates the consent-control gap operating across time. The mandate is generational. The machinery moves on the scale of a childhood. The electoral cycle that authorises the mandate is shorter than the institutional cycle that produces the outcome. Voters are asked to judge education policy on a timescale incompatible with the educational process itself.
4.4.1 The Mandate
Every recent British manifesto, across parties, has promised some version of opportunity. “World-class education,” “raising standards,” “closing the attainment gap,” “social mobility,” “skills for the future” - the rhetorical packaging varies but the substance is consistent. The British political contract on education is that the state will provide for every child an education sufficient to give them a fair chance in adult life, regardless of where they were born or what their parents earn.
This is one of the most morally loaded mandates in British politics. It is also one of the most institutionally specific. The Department for Education holds nominal responsibility for school standards, qualifications, the curriculum, the teacher workforce, and the special educational needs framework. Successive governments have made specific operational commitments: pupil premium funding to reduce the disadvantage gap (introduced 2011); the Progress 8 measure (since 2016); targets for new free schools and academies; commitments on teacher recruitment, retention, and pay; specific responses to SEND backlogs; early years entitlements. The mandate is, in other words, both morally vague and operationally specific - the most ambitious promise British politics routinely makes, and the most institutionally complex it routinely tries to deliver.
The delivery picture is more nuanced than in housing or the NHS, because education outcomes are themselves complex, multi-causal, and slow to register. What is clear is the trajectory on disadvantage. The Education Policy Institute’s annual disadvantage gap analysis - which expresses the difference in average attainment between pupils eligible for free school meals and their peers in equivalent months of educational development - records a gap at Key Stage 4 of approximately 18.1 months in 2019, rising to a peak of 19.2 months in 2023 and narrowing slightly to 19.1 months in 2024.51 This is the widest the gap has been at the end of secondary school since the EPI series began in 2011. Among persistently disadvantaged pupils - approximately 13 per cent of the cohort - the equivalent gap in 2024 was 22.4 months. In the 2024 GCSE cohort, 25.8 per cent of disadvantaged pupils achieved grade 5 or above in English and mathematics, compared with 53.1 per cent of their non-disadvantaged peers.52 Progress made in narrowing the gap during the early 2010s stalled by mid-decade, and the gap has widened since the pandemic; the slight narrowing in 2024 does not yet establish a sustained trend.53 These figures reflect the conjoined impact of the pandemic, broader cost-of-living pressures, and longer-running structural patterns; no single cause is sufficient to explain them.
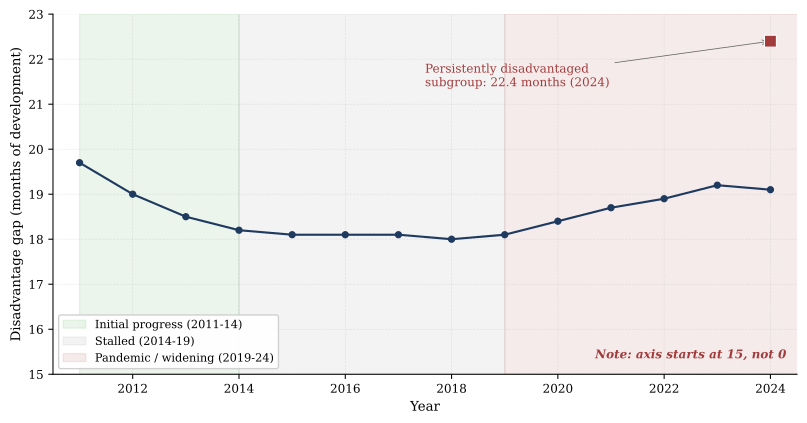
The teacher workforce position is similarly complex. Recruitment to initial teacher training has missed targets in several recent years, particularly in shortage subjects (physics, mathematics, modern foreign languages, computing). Retention has weakened, with departures of newly qualified teachers within the first five years of training rising over the past decade. These are not the only signals - teacher pay, working conditions, and a constrained labour market for graduates with options also matter - but the cumulative effect is a profession operating under capacity in many subjects and geographies.54
The Special Educational Needs and Disabilities system illustrates the consent-control gap most acutely. The number of children with Education, Health and Care Plans (EHCPs) - the statutory document required for the most significant special educational needs - rose from approximately 240,000 in 2015 to 576,000 in January 2024, an increase of approximately 140 per cent over nine years.55 Total identified SEN, including the broader “SEN support” category, stands at approximately 1.9 million children. Local authority high needs budgets have not kept pace; council projections indicate a cumulative deficit of approximately £8 billion by March 2027, currently kept off council balance sheets by a “statutory override” extended to March 2028.56 In 2023, the share of EHCPs issued within the statutory 20-week deadline ranged from 1 per cent to 100 per cent across local authorities.57 Families appealing to the SEND Tribunal have won their cases in around 95-99 per cent of decided cases across recent reporting years, indicating systematic underprovision against the statutory standard.58 None of these features is a simple result of funding cuts. They are the visible signs of a system whose institutional framework, designed in earlier decades, no longer matches the demand it is asked to meet.
4.4.2 The Machinery
The machinery for delivering on the education mandate contains, at minimum: the Department for Education (which sets policy, the National Curriculum, the qualifications framework, and the school accountability regime); the Treasury (which determines per-pupil funding, capital programmes, and apprenticeship policy); 153 local authorities (which retain responsibility for maintained schools, admissions, school place planning, and the SEND statutory framework); approximately 2,400 multi-academy trusts (which run the majority of secondary schools and a growing share of primary schools, with their own governance and accountability to DfE); over 24,000 schools (state, academy, independent, and faith); Ofsted (the inspection body whose judgements substantially shape school behaviour); five exam boards (which set and mark the qualifications by which the system is judged); thousands of early years providers (private, voluntary, and maintained, delivering the entitled free hours); the teacher labour market (which has no centrally managed workforce pipeline of the kind the NHS operates); university teacher training providers and Teach First; the SEND tribunals system; universities (which determine the criteria by which pupil outcomes will ultimately be valued); the childcare sector (which determines the readiness of children entering Reception); the housing system (which determines where families with school-age children can live and which schools they can therefore attend); family resources (which research consistently shows are the single largest determinant of educational outcomes); and geography (the postcode lottery that the rest of the machinery is at best partially designed to neutralise).
The educational machinery has a specific feature distinguishing it from housing, NHS, and energy: a substantial portion of what determines outcomes happens outside any institution the state directly controls. Family income, parental education, housing stability, neighbourhood, peer effects, and the early years before formal schooling all shape attainment to a degree that exceeds the explanatory power of school-level variables in most contemporary research. The state can intervene in many of these through tax credits, housing policy, childcare subsidies, and public health - but the institutions that deliver education are not the institutions that produce most of the variation in educational outcomes.
The time dimension is the other distinctive feature. A child starting Reception in September 2026 will complete compulsory education in July 2037. A policy announced in 2026 will reach that child’s actual cohort only if it survives a probable change of government in 2029, possible further changes in 2034, and any number of subsidiary shifts in Ofsted leadership, exam board policy, DfE priorities, and Treasury settlements over the intervening eleven years. The longest mandate any British government can credibly make is a fraction of the time a single child spends in the educational system. This is not unique to education - infrastructure has the same problem - but in education it is particularly acute because the outcomes voters care about (qualifications, life chances, social mobility) arrive only at the end of the cycle.
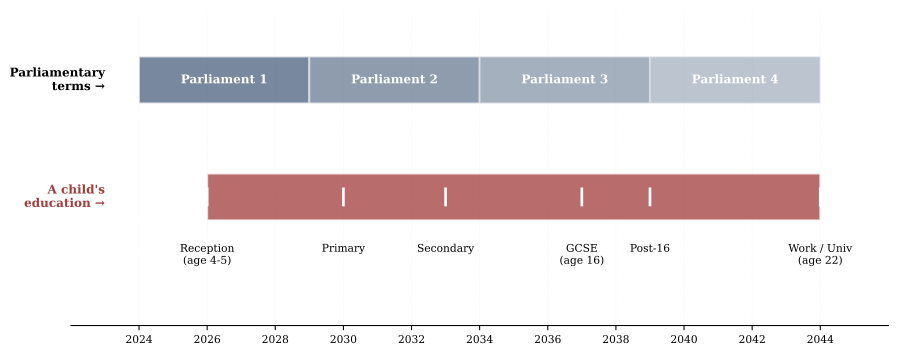
4.4.3 The Gap
Cause - the mandate disperses. A national commitment to opportunity passes from the Prime Minister to the Education Secretary, the Treasury, the DfE, Ofsted, the exam boards, 153 local authorities, approximately 2,400 multi-academy trusts, over 24,000 schools, the teacher labour market, the childcare sector, and into the homes where most of the variation in educational outcomes is actually generated. Each step contains real agency. None is fully commanded by the political mandate. A government can mandate a curriculum. It cannot mandate that there be enough physics teachers to deliver it.
Observe - the chain becomes illegible. When a parent sees that their child’s school is struggling, they cannot easily tell whether the cause is a budgetary constraint, a headteacher decision, the academy trust’s strategic direction, the local authority’s SEND placement decisions, the exam board’s recent specification changes, an Ofsted inspection outcome from three years ago that altered the school’s strategy, a teacher recruitment failure, a policy change announced in Whitehall but only now reaching the classroom, or the conjoined effect of all of these. The observed outcome - declining results, exhausted teachers, unmet SEND needs - is identical regardless of which institutional layer is responsible. Parental voice increasingly operates through formal complaint, appeal, and tribunal mechanisms rather than through civic structures capable of turning school-level decisions into public accountability: engaged governing bodies, local education reporting, visible local authority responsibility, and active parent networks.
Judge - attribution becomes circular. Government blames local authorities and academy trusts for variable delivery. Local authorities blame government for underfunding and unfunded mandates, particularly on SEND. Academy trusts point to the constraints of national policy and inspection regimes. Schools point to the workforce shortages and SEND demands they cannot fully meet. Ofsted points to its statutory framework. Exam boards point to specifications determined upstream. Universities point to school-level preparation. Parents, increasingly, point to all of the above and to the broader social and economic conditions in which their children grow up. As with the other domains, each position captures part of a delivery chain in which responsibility is genuinely shared - but the chain runs through institutions, markets, families, and time horizons that no single democratic mandate can credibly span.
The temporal mismatch is the distinctive feature. The Prime Minister can announce a school improvement programme. The children whose lives that programme will materially shape are, in many cases, not yet born. The voters who will judge the programme’s success are voting on the basis of educational outcomes for cohorts whose schooling was substantially complete before the programme began.
Table 4.4: Education machinery map — headline data
| Dimension | Evidence |
|---|---|
| Mandate | Opportunity, mobility, world-class standards; specific operational commitments on disadvantage gap, teacher workforce, SEND |
| Outcome (disadvantage) | KS4 disadvantage gap ~18.1 months (2019) → 19.1 months (2024), widest in EPI series since 2011; persistent disadvantage gap 22.4 months (2024); 25.8% vs 53.1% achieving grade 5+ in English/maths (2024) |
| Outcome (SEND) | EHCPs ~240,000 (2015) → 576,000 (January 2024), +140% in nine years; LA EHCP timeliness 1%-100% within 20-week statutory deadline; tribunal win rate ~95-99% in recent years |
| Funding/deficit | Council SEND deficits projected to cumulative ~£8bn by March 2027; statutory override extended to March 2028 |
| Machinery scale | DfE + Treasury + 153 LAs + ~2,400 MATs + 24,000+ schools + Ofsted + exam boards + early years sector + teacher labour market + SEND tribunals + universities + childcare + housing + family resources + geography |
| Cause break | Mandate disperses across formal institutions AND non-state determinants (families, neighbourhoods, early years) |
| Observe break | Outcomes are multi-causal and visible only at end of long process |
| Judge break | Attribution circulates between government, LAs, trusts, schools, exam boards, Ofsted, families, broader social conditions |
| Distinctive feature | Time horizon (Reception to GCSE = 11 years; full educational outcomes longer) exceeds electoral cycles |
Education is the case where the consent-control gap operates across time. The state can promise opportunity within a parliament. The opportunity itself, if it materialises, will be visible only when the cohort the promise was made to has completed an education that runs for longer than the parliament that authorised it. Voters are asked to consent to mandates whose outcomes they will only see when the political circumstances of the original consent have substantially changed. This is not a reason to abandon educational ambition. It is a reason to be honest about the timescales involved, and to design democratic accountability mechanisms that work over the lifetimes of children rather than the lifetimes of governments.
4.5 Cross-Sector Summary
The four machinery maps developed in this section illustrate the same underlying pattern through different mechanisms. Table 4.5 compresses the analysis into a comparative grid.
Table 4.5: Cross-sector summary of British consent-control gaps
| Dimension | Housing | NHS | Energy | Education |
|---|---|---|---|---|
| Mandate | 300k homes a year | 92% treated within 18 weeks | Affordable, secure, net zero by 2050 | Higher standards; close the disadvantage gap |
| Outcome | Never met; 208,600 in 2024-25 | Unmet since 2016; list peaked at 7.77m (2023) | Bills ~35% above pre-crisis; queue hit 700 GW | KS4 gap 18.1 → 19.1 months (2019-24); SEND demand +140% |
| Who delivers it | Localised, market-mediated | Nested bodies under one brand | Global markets and infrastructure | Families and time, not just schools |
| Why it breaks down | Mandate disperses through 12+ layers | Same-brand fragmentation | Key variables outside national control | Childhood outlasts the electoral cycle |
| What voters see | One delay, many possible causes | One waiting list, many bottlenecks | One bill rise, many causes | One result, only at the end |
| Who gets blamed | Govt, councils, developers, regulators | Govt, NHSE, Treasury, trusts, care | Govt, Ofgem, NESO, networks, markets | Govt, councils, trusts, schools, families |
| Time horizon | 5-8 years | 2-10 years | 5-15 years | 11-18 years |
While each case has a distinctive dominant mechanism - fragmentation across markets in housing, nested institutional density in the NHS, external exposure in energy, and temporal mismatch in education - three patterns hold across all four. First, the mandate in each case is national; the machinery is sub-national, supra-national, or non-state. Second, the time between mandate and visible outcome exceeds the electoral cycle in every domain. Third, the count of institutions in each delivery chain is large enough that no ordinary voter can be expected to identify which layer is responsible for an observed outcome.
These are not the signs of a system facing exceptional pressures. They are the signs of a system whose institutional architecture has accumulated faster than its accountability mechanisms can track. The consent-control gap is not a feature of any one of these domains. It is a feature of the relationship between democratic mandate and institutional delivery across the policy areas that most determine the texture of British life. Section 5 examines why the standard responses to this pattern have failed to address it.
5. Why the Standard Answers Misdiagnose the Gap
5.1 Two Responses to the Same Discontent
Once the consent-control gap is named, it becomes possible to see why the two most prominent political responses to Britain’s democratic discontent - technocratic competence and populist responsiveness - are unsatisfying. Both diagnoses are partly correct. Both target features of the gap rather than the gap itself. Neither, as a result, succeeds in narrowing it; both can widen it if pursued in their stronger forms.
This is not a complaint that politicians and commentators have failed to grasp an abstract concept. It is an analytical claim with concrete implications. If the gap is an architectural mismatch between democratic input and institutional action, then remedies aimed at either side alone leave the architecture intact. The control problem cannot be solved by improving competence inside an illegible system; the consent problem cannot be solved by intensifying democratic theatre over an institutional landscape that no longer reliably responds to it. Both responses address something real. Neither addresses the relationship.
The terms are used here as ideal-types rather than as exhaustive descriptions of political traditions. In practice, most governments contain both technocratic and populist impulses: expert delegation in some areas, democratic dramatisation in others. The distinction matters because each impulse misreads the consent-control gap in a different direction.
5.2 Technocracy as a Competence Diagnosis
The technocratic response treats the consent-control gap as fundamentally a competence problem. On this view, the difficulty is not that voters cannot reach the machinery; it is that the machinery is staffed, organised, and incentivised in ways that produce poor delivery. The remedies follow: hire better people, depoliticise key decisions, give regulators stronger powers, professionalise the civil service, attract talent from the private sector, measure outcomes more rigorously, build capacity for execution, and insulate technical judgement from political pressure.
There is a great deal that is right about this diagnosis. State capacity is a necessary condition for any closing of the consent-control gap. A government that cannot execute cannot deliver mandates, regardless of how clearly authorised those mandates were. Britain’s specific patterns of administrative decline - hollowed-out specialist capability, repeated reorganisations, pay compression, the displacement of in-house expertise by external consultancy - are real and material contributors to the gap. Restoring administrative capability is part of any plausible remedy.
But the technocratic response misdiagnoses the relationship between consent and control in two ways.
First, it tends to treat ongoing democratic consent as interference. The implicit logic is that voters authorise direction at the ballot box and that institutions should then deliver, with as little political intrusion as possible during the intervening period. This is a coherent administrative philosophy but a degraded democratic one. It improves control by weakening the live operation of consent, turning democratic authorisation into a one-off licensing event rather than an ongoing relationship.
Second, it tends to widen the legibility problem rather than narrow it. When more decisions are insulated from political pressure - assigned to independent bodies, technical regulators, specialist tribunals, expert reviews, semi-autonomous agencies - the institutional landscape becomes more sophisticated and less legible to the voters who are still asked, formally, to authorise and judge it. Capacity rises; visibility falls. The state becomes better at doing things while becoming harder to hold accountable for the things it does. Over time, this produces effective technocracy rather than capable democracy.
Technocracy, in short, can improve control while weakening consent. It treats the gap as a problem to be solved by reducing the role of consent in delivery. That is one solution to a poorly functioning architecture. It is not a solution to the consent-control gap, because the gap is precisely the mismatch between democratic consent and practical control. It does not close the gap; it reduces the role of consent.
5.3 Populism as a Representation Diagnosis
The populist response treats the consent-control gap as fundamentally a representation problem. On this view, the difficulty is not that the machinery is too complex; it is that the machinery has been captured by elites whose interests diverge from those of ordinary citizens. The remedies follow: take power away from regulators, courts, central banks, supranational bodies, and unelected experts; return decisive authority to elected leaders directly accountable to “the people”; weaken the institutional constraints that allow elite interests to override popular preferences.
Like the technocratic diagnosis, this has real purchase. Distributed institutional power can serve concentrated interests as easily as it serves public goods. Regulatory capture is a documented phenomenon, not a populist invention. Many of the institutions that resist democratic mandates do so not because they are politically neutral but because they reflect older settlements that no longer enjoy democratic support. Naming this is not paranoia; it is political economy.
But the populist response misdiagnoses in mirror-image ways to the technocratic one.
First, it treats institutional complexity as a contingent problem of bad actors rather than a structural feature of modern governance. The implicit assumption is that if elites were removed and constraints loosened, popular mandates could be straightforwardly executed. This underestimates the extent to which the complexity is real: bond markets, supply chains, international agreements, scientific evidence, technical infrastructure, and irreducible policy trade-offs do not dissolve when the right people are in charge. Sweeping institutional constraints aside does not give voters control over outcomes; it simply changes which actors are exposed when the outcomes prove unmanageable.
Second, populism tends to widen the consent problem rather than narrow it. By treating “the people” as a unified principal whose will can be straightforwardly identified, it obscures the genuine plurality of democratic societies and the genuine difficulty of resolving conflicting preferences. The dramatisation of consent through plebiscite, charismatic leadership, or symbolic confrontation does not solve the architectural problem; it overlays a louder political theatre on a delivery system that remains unchanged or weakened. Mandates are intensified rhetorically while becoming harder to operationalise practically.
Populism, in short, can dramatise consent while exaggerating control. It treats the gap as a problem to be solved by amplifying democratic input, on the assumption that institutional output will follow. When it does not - because the underlying machinery has been attacked rather than reformed - the resulting failure is typically blamed on continued elite obstruction, generating further calls for more dramatic interventions. The gap is not closed; it is concealed beneath increasingly intense democratic performance.
5.4 What Both Miss
Technocracy and populism are not merely policy preferences. They are rival maps of where power is thought to reside. Technocracy locates failure in competence. Populism locates failure in representation. The consent-control gap locates failure in the architecture connecting authorisation to execution.
Technocracy answers the question by reassigning authority to better-trained actors. Populism answers it by reassigning authority to more democratically legitimate actors. Both leave intact the architectural fact that produces the gap: that the institutional translation of democratic mandates into material outcomes has become too fragmented, too slow, too technical, and too opaque to function as a recognisably democratic process, regardless of who is formally in charge.
The implication is that neither competence nor representation, taken alone, is the analytical category that matches the problem. The gap is structural before it is personal. It concerns the design of institutions, not only the qualities of the people who staff them or the legitimacy of those who command them.
This has direct consequences for the kind of remedy the diagnosis implies. If the gap is architectural, then closing it requires architectural work: making delivery chains shorter, more legible, and more accountable; making the relationship between authorisation and execution traceable across institutional layers; making the actual locations of decision-making visible to the citizens nominally responsible for them. None of this is achieved by replacing one set of actors with another. It is achieved by redesigning the relationship between consent and control - or, where necessary, accepting that some decisions cannot reasonably be made through electoral mandate and saying so explicitly, rather than maintaining the fiction that they can.
The category of remedy implied by the diagnosis is therefore not less democracy, in the technocratic mode, or louder democracy, in the populist mode. It is more capable democracy: democratic institutions designed not only to authorise power, but to organise, execute, explain, and judge it.
That is not yet a programme. But it does indicate the kind of programme required. If the consent-control gap is architectural, then the answer must be architectural too: shorter delivery chains, visible constraints, named responsibility, stronger local capacity, and democratic feedback mechanisms that operate between elections rather than only at them. The question is not how to make democracy louder. It is how to make democratic consent travel.
The consent-control gap persists because it is not simply a problem of who governs. It is a problem of how mandate becomes machinery.
6. Toward Capable Democracy
This section sketches the principles that follow from the architectural diagnosis developed in Sections 1 to 4. It is not a programme. The institutional detail - which delivery chains to shorten, which agencies to redesign, which feedback mechanisms to build - belongs to the companion piece. What follows here is the category of answer the diagnosis implies. Five principles, drawn directly from the three variables identified in Section 3 and the four machinery maps in Section 4, define what a more capable democracy would look like.
6.1 Shorter Chains
The first principle is that delivery chains should be shortened wherever they can be. The British housing chain involves at least a dozen distinct institutions between the national mandate to build more homes and the homes themselves. Each handoff disperses the mandate; each layer adds time, cost, and opacity. No serious account of housing delivery in Britain can avoid the conclusion that fewer institutional steps would produce more outcomes with more accountability.
Shortening chains does not mean abolishing institutions. It means reducing the number of veto points between mandate and outcome, locating decisions at the level of government with both the capacity and the legitimacy to make them, and resisting the British reflex of creating a new arms-length body whenever a delivery problem appears. Denmark suggests one route: the genuine devolution of competence to local authorities capable of absorbing it. The relevant move is not federalism in the formal sense, but capacity at the level of government closest to the people affected by the decision.
6.2 Visible Machinery
Where chains cannot be shortened, they must be made visible. The German lesson from Section 3 is that a delivery chain is governable when its blockages are political events rather than administrative accidents.
In practice this means: public dashboards that show where mandates are in the delivery chain; named institutional responsibility for each stage; live publication of bottlenecks, including statutory consultee objections, regulator decisions, and planning delays; and an end to the British convention by which ministers claim credit for headline announcements while leaving the operational chain unexplained until it fails. The technical infrastructure for this exists. What has been missing is the political appetite to make delivery legible, because legibility makes ministers and institutions answerable for what they actually do.
Consider the housing target. Instead of a single national number, announced and then defended, the commitment to 300,000 homes a year would appear as a live mandate chain: land identified, permissions granted, statutory objections logged, infrastructure blockers named, starts recorded, completions delivered - each stage with a named owner and a published figure. A target that is only a number can be missed quietly. A target that is a visible chain can be missed only in public, at the precise point where it breaks.
An invisible delivery chain cannot produce democratic accountability. It can only produce the illusion of it.
6.3 Accountable Discretion
Some decisions in any modern state should be insulated from electoral pressure: judicial independence, monetary policy, technical regulation, treaty obligations, and statistical integrity all require time horizons and forms of expertise that electoral politics cannot supply. The objection to the British settlement is not that it has delegated such decisions. It is that delegation has often been opaque, with remit, accountability, and contestation routes left unclear.
The principle is accountable discretion. Where a regulator, court, or independent body constrains a democratic mandate, the reason should be visible, the body’s remit should be public, and the route by which voters can change the constraint should be clear. The Bank of England operates broadly within these constraints; many British regulators do not. Insulation from politics is defensible. Insulation from scrutiny is not.
6.4 Feedback Between Elections
Five-yearly elections are too blunt an instrument to govern complex delivery systems. A capable democracy needs scaffolding around its elections: mechanisms through which citizens can be heard, informed, and responded to between trips to the ballot box.
This means restoring local government as a meaningful site of decision-making rather than a delivery agent for national policy. It means citizens’ assemblies on the kinds of long-horizon trade-offs - climate policy, planning reform, the future of public services - that electoral cycles handle badly. It means stronger parliamentary scrutiny of executive action, more transparent consultation processes, and the rebuilding of the civic ecology - local journalism, civic associations, party structures, and other institutions of political knowledge - whose collapse Section 1 identified as the other side of the gap. Some of these reforms are administrative; others are cultural. Together they describe a democracy that uses its years between elections rather than waiting passively through them.
6.5 Honest Steering
The fifth principle is rhetorical as much as institutional. British political language still pretends that ministers command outcomes the system can only steer toward. Interest rates, global energy prices, demographic change, technological disruption, and many features of the international economy cannot be commanded by any national government. Promising what cannot be delivered widens the gap directly: it raises expectations the machinery cannot meet, and erodes trust when the inevitable shortfall arrives.
A capable democracy would distinguish, in public, between what governments command and what they steer; between targets they can deliver and conditions they can influence; between mandates that bind institutions and aspirations that depend on actors no election controls. This is harder politics, because it offers fewer easy victories. But it is more honest politics, and over time honest politics is the only kind that sustains consent. A government that admits its constraints can be trusted to act within them. A government that does not loses the trust of those who can see, increasingly clearly, the gap between its language and its reach.
6.6 Neither Less nor Louder
None of these principles is novel. Each has been argued for in various forms across the British policy literature for decades. The reason they have not, in combination, been implemented is not intellectual but institutional: the British political system has incentives that point in the opposite direction. Centralisation concentrates parliamentary power. Opacity protects ministers from blame. Outsourcing distributes responsibility without accountability. Rhetorical command compensates, in the short term, for operational weakness.
The argument of this paper is that those incentives have produced a settlement which now actively damages the consent it requires to function. Trust has fallen for nearly four decades. The voice gap is now one of the largest single discriminators of trust in OECD democracies. Targets are repeatedly set and repeatedly missed across the policy domains that matter most to ordinary lives. Britain sits, by the international comparators developed in Section 3, on the unfavourable side of each variable that determines whether the consent-control gap is narrow, legible, or governable.
None of the principles sketched in this section is free of trade-offs. Shortening delivery chains through devolution risks postcode lottery and capture by organised local interests. Making constraints visible can slow decisions that are sometimes urgent. Accountable discretion still depends on contestation mechanisms most citizens lack the time or expertise to deploy. Feedback between elections can be captured by activist minorities rather than the broader public. Honest steering about what governments cannot command is electorally punishable, because voters often prefer the comfort of believing that someone is in charge of outcomes that are genuinely beyond political reach. Each principle is harder than it sounds. None of them, individually or together, eliminates the underlying complexity. The case for capable democracy is therefore not that these moves are easy or costless. It is that the path Britain is currently on - centralised authority without delivery, opacity without insulation, rhetorical command without operational reach - is worse.
The case for capable democracy is not nostalgic. The argument is more demanding and more modest at once: that a democracy in the twenty-first century needs institutions capable of governing the complexity it has inherited, and that Britain’s institutions, in their current form, are not.
Consent remains the source of legitimacy. But consent is not a delivery system.
The task is not to restore an imaginary past in which democracy simply worked. It is to build institutions in which consent can travel: through shorter chains, clearer responsibility, visible bottlenecks, and forms of judgement that operate before everything has already failed.
A democracy that forgets this becomes theatrical. A democracy that repairs it may yet become capable.
The vote still works. The task is to make it reach again.
Bibliography
Alliance of Democracies Foundation and Latana. Democracy Perception Index. Annual series, 2020–2025.
Barker, K. Barker Review of Housing Supply: Delivering Stability — Securing our Future Housing Needs. HM Treasury, 2004.
Breach, A., Carter, A. and Watling, S. The Housebuilding Crisis: The UK’s 4 Million Missing Homes. Centre for Cities, 2023.
British Election Study. Internet Panel, Waves 1–26 (2014–2024).
Capital Economics. The Origin of the Government’s 300,000 Target. 2024.
Climate Change Committee. The Sixth Carbon Budget. 2020.
Conservative Party. Get Brexit Done: Unleash Britain’s Potential — Manifesto 2019.
Department for Business and Trade. Trade Union Membership Statistics. UK series.
Department for Education. Key Stage 4 Performance, 2024; Education, Health and Care Plans (EHC Plans): England, January 2024; EHC Plans Statistics: Timeliness of Issuing; Initial Teacher Training recruitment data.
Department of Health and Social Care. Reforming Elective Care for Patients, 2025; NHS Constitution for England.
Education Policy Institute. Annual Report: Disadvantage. Multiple years, to 2025.
Health Foundation. Public Satisfaction with the NHS and Social Care (British Social Attitudes), 2025.
HM Government. Clean Power 2030 Action Plan. 2024.
HM Treasury. Public Expenditure Statistical Analyses. Annual series.
Home Builders Federation. Planning on Empty. 2025.
House of Commons Library. Membership of Political Parties in Great Britain (SN05125); General Election 2024: Results and Analysis (CBP-10009); Stimulating Housing Supply: Government Initiatives (England) (SN06416).
Institute for Fiscal Studies. Public Spending on Health and Social Care. Various years.
Ipsos. Veracity Index 2025; (as Ipsos MORI) Trust in Public Institutions, 2002.
Jennings, W., Stoker, G., et al. “The Decline in Diffuse Support for National Politics.” Public Opinion Quarterly 81(3), 2017.
Labour Party. Change: Labour Party Manifesto 2024.
Lichfields. Start to Finish: How Quickly Do Large-Scale Housing Sites Deliver? 2nd ed., 2020; 3rd ed., 2024.
Ministry of Housing, Communities and Local Government. Housing Supply: Net Additional Dwellings, England. Annual series.
National Centre for Social Research (NatCen). British Social Attitudes, multiple years; British Social Attitudes 42, 2025.
National Energy System Operator (NESO). Connections Reform; Future Energy Scenarios. 2023–2025.
National Foundation for Educational Research (NFER). Teacher recruitment and retention analysis.
NHS Digital. Estates Returns Information Collection (ERIC).
NHS England. Referral to Treatment Waiting Times; NHS Workforce Statistics.
OECD. Survey on Drivers of Trust in Public Institutions — 2024 Results. OECD Publishing, 2024; Government at a Glance 2025; Health Statistics.
Ofgem. Default Tariff Cap; Review of GB Electricity Market Arrangements (REMA).
Press Gazette. Local Newspaper Closures: UK 2005–2024.
Scharpf, F. W. Governing in Europe: Effective and Democratic? Oxford University Press, 1999.
UK Parliament POST. Trust, Public Engagement and UK Parliament (POSTbrief 66, 2025); Democratic Engagement and Trust in Parliament, 2025.
Notes
House of Commons Library, Membership of political parties in Great Britain, Briefing Paper SN05125. Membership of the Conservative, Labour and Liberal Democrat parties stood at approximately 1.5 per cent of the electorate in 2022, compared with a 1983 share of around four per cent and a long-term mid-twentieth-century peak considerably higher. The trend is downward over the long run despite cyclical surges around particular leaderships and referendums.↩︎
Department for Business and Trade, Trade Union Membership Statistics, UK series, drawing on the Labour Force Survey and Certification Office returns. Trade union membership in the UK peaked at over 13 million in 1979 and stood at approximately 6.4 million in 2021, covering 23.1 per cent of employees.↩︎
Press Gazette has reported that approximately 293 UK local print titles closed between 2005 and 2024 (Local newspaper closures: UK 2005-2024, ongoing series). Separate industry reporting indicates steep reductions in regional newsroom headcount at the largest publishers (Reach, Newsquest, National World) over the same period. Workforce figures should be treated cautiously: different sources count journalists, editorial staff, or full newsroom headcount differently.↩︎
The most-cited single survey finding (Ipsos MORI, Trust in Public Institutions / local government studies, 2002) reported that 61 per cent of respondents could not name any of their local councillors, rising to 76 per cent in London. Recent comprehensive UK polling on local government recognition is limited, and the underlying claim - low routine public familiarity with local representatives - is widely supported in subsequent local government and civic engagement research. The headline figures should therefore be treated as illustrative of a long-running pattern rather than precise contemporary measures.↩︎
National Centre for Social Research (NatCen), British Social Attitudes, multiple years. The trust-in-government question asks how much respondents trust British governments of any party to place the needs of the nation above the interests of their own political party, with response options “just about always,” “most of the time,” “only some of the time,” and “almost never.” The “always / most of the time” share has fallen from approximately 40 per cent in the mid-1980s to around 12-14 per cent in the most recent published waves; the BSA 42 release (2025) is the most recent at time of writing.↩︎
British Election Study Internet Panel, Waves 1-26 (February 2014 - May 2024). Summarised in UK Parliament POST, Trust, Public Engagement and UK Parliament, POSTbrief 66 (21 May 2025).↩︎
British Election Study Team analysis of BESIP data, cited in UK Parliament POST, Democratic Engagement and Trust in Parliament (March 2025).↩︎
Ipsos, Veracity Index 2025. The Veracity Index has been conducted annually since 1983 and tracks public trust in different professions to tell the truth. Politicians and government ministers have ranked at or near the bottom for most of the series’ history.↩︎
OECD, Survey on Drivers of Trust in Public Institutions - 2024 Results: Building Trust in a Complex Policy Environment (OECD Publishing, 2024). Survey fielded in late 2023 across 30 OECD member countries. The UK survey was administered by the Office for National Statistics on behalf of the Cabinet Office and OECD.↩︎
OECD, Survey on Drivers of Trust in Public Institutions - 2024 Results: Country Notes (2024). Trust levels reported here use the OECD’s 0-10 scale aggregated at 6-10 as “high or moderately high.” Other survey traditions (such as Gallup’s yes/no confidence measure) produce different numerical levels and are not directly comparable; the OECD methodology is used consistently throughout this paper.↩︎
OECD, Survey on Drivers of Trust in Public Institutions - 2024 Results, Figure 1.11.↩︎
OECD, Survey on Drivers of Trust in Public Institutions - 2024 Results, Overview chapter. The OECD describes this as one of the largest disparities associated with any single variable in the survey.↩︎
House of Commons Library, General Election 2024: Results and Analysis, Briefing Paper CBP-10009 (2024). Labour won 411 of 650 seats (approximately 63 per cent of the total) on 33.7 per cent of the popular vote.↩︎
NatCen Social Research, British Social Attitudes 42 (published 2025, fieldwork conducted 2024). The 2024 BSA found that satisfaction with the system of governing Britain remained near the lowest levels recorded in the survey’s history, with approximately 79 per cent of respondents saying the system needed “quite a lot” or “a great deal” of improvement and only around 19 per cent saying it needed only small improvements or none.↩︎
NatCen Social Research, British Social Attitudes 42; see note 14.↩︎
For an overview of the literature on trust decline as antecedent rather than consequence of populist movements, see Jennings, W., Stoker, G., et al., The Decline in Diffuse Support for National Politics: The Long View on Political Discontent in Britain, Public Opinion Quarterly 81(3) (2017), pp. 748-758.↩︎
OECD, Survey on Drivers of Trust in Public Institutions - 2024 Results: Country Notes - Denmark. Trust figures use the OECD’s 0-10 scale aggregated at 6-10 as “high or moderately high.” Cross-method comparisons (e.g. with Gallup’s yes/no confidence measure) yield different absolute numbers and are not directly substitutable; this paper uses OECD Drivers of Trust 2024 methodology consistently.↩︎
OECD, Government at a Glance 2025 and Subnational Government Structure and Finance statistics. Local government accounted for 64.3 per cent of total Danish public spending in 2023, the highest share in the OECD. The UK figure on a comparable measure is materially lower, reflecting four decades of fiscal centralisation. See also Council of European Municipalities and Regions, Local and regional government in Europe: Structures and competences.↩︎
OECD, Survey on Drivers of Trust in Public Institutions - 2024 Results. US trust in national government on the OECD 6-10 scale sits broadly comparable to the UK level. Separately, the Alliance of Democracies Foundation / Latana Democracy Perception Index 2025 recorded a substantial decline in international perception of the United States as a force for democracy, with US net global perception falling from approximately +22 (2024) to -5 (2025). This is an external rather than internal measure and is not used here as evidence on American domestic consent-control mechanics; it is noted because the trajectory tracks the same period in which other US delivery and trust indicators have weakened.↩︎
Alliance of Democracies Foundation and Latana, Democracy Perception Index, multi-year series 2020-2025. The recurring finding that approximately 70-80 per cent of Chinese respondents describe their country as democratic, and over 90 per cent state that the government serves the interests of most people, has held across multiple waves with broadly stable methodology. The accompanying Russian time series (showing material decline in equivalent metrics post-2022, despite arguably similar authoritarian constraint on response) is the primary internal evidence that the Chinese figures cannot be attributed simply to state-mandated compliance or response fear.↩︎
Scharpf, F.W., Governing in Europe: Effective and Democratic? (Oxford University Press, 1999), particularly chapter 1 on the input/output dimensions of democratic legitimacy. The framework has been widely developed in subsequent European governance literature; the application to the British case here is the author’s own.↩︎
Barker, K., Barker Review of Housing Supply: Delivering Stability - Securing our Future Housing Needs (HM Treasury, March 2004). The Review modelled the additional supply required to keep UK house price growth in line with the European average and supplied the analytical basis subsequently summarised as the “300,000 homes a year” benchmark. The 2024 Capital Economics rerun of the Barker calculations is reported in Capital Economics, The origin of the government’s 300,000 target (2024).↩︎
Conservative Party, Get Brexit Done: Unleash Britain’s Potential - The Conservative and Unionist Party Manifesto 2019, p. 31. The Autumn Budget 2017 first set out the 300,000 by mid-2020s ambition formally; the 2019 manifesto repeated it as a continuing commitment. See also House of Commons Library, Stimulating housing supply: Government initiatives (England), Briefing Paper SN06416.↩︎
Statement by the Rt Hon Michael Gove MP, then Secretary of State for Levelling Up, Housing and Communities, on the BBC Today programme, 11 May 2022, reported in Building, “Government not bound by 300,000-home manifesto target, says Gove” (11 May 2022).↩︎
Labour Party, Change: Labour Party Manifesto 2024, p. 36. The arithmetic (1.5 million homes over a five-year parliament = 300,000/year average) is the same target the previous government had committed to, expressed in cumulative rather than annual form. No claim is made here about whether the current government is on track to meet this commitment; mandate-delivery is non-linear in housing and the parliament has yet to complete its term.↩︎
Ministry of Housing, Communities and Local Government, Housing supply: net additional dwellings, England, 2024-25 (November 2025). The 2024-25 figure of 208,600 is provisional. The series covers official publications across years; the responsible department’s name has changed several times (DCLG, MHCLG, DLUHC, MHCLG) and previous years’ figures have been periodically revised, most recently following 2021 Census recalibration.↩︎
Capital Economics, The origin of the government’s 300,000 target (2024); National Housing Federation and Crisis, Housing supply requirements across Great Britain for low-income households and homeless people (Heriot-Watt University, 2018, multiple updates).↩︎
Breach, A., Carter, A. and Watling, S., The Housebuilding Crisis: The UK’s 4 Million Missing Homes (Centre for Cities, February 2023). The report estimates that closing the accumulated housing backlog with the European average would require approximately 442,000 homes a year for 25 years or 654,000 a year for 10 years.↩︎
Lichfields, Start to Finish: How quickly do large-scale housing sites deliver? - Third Edition (March 2024), drawing on 297 sites delivering a combined 387,000 dwellings. The eight-year figure for 2,000+ unit sites cited here derives from the earlier Start to Finish second edition (2020); subsequent editions broadly corroborate the time-lag pattern while refining build-out rate analysis.↩︎
Home Builders Federation, Planning on Empty (updated February 2025), based on Freedom of Information returns from 134 local planning authorities. The 19-20 per cent figure refers to major applications determined within the statutory 13-week period; performance against the broader “13-week or agreed extended period” measure is materially higher and the difference is the subject of methodological dispute between HBF and government statisticians.↩︎
Breach, A., Carter, A. and Watling, S., English and Welsh housing supply since the Second World War, in The Housebuilding Crisis (Centre for Cities, 2023), drawing on housebuilding data from 1856 to 2019 reconciled with United Nations comparative housing data from 1955 to 2015. The 1.9 per cent figure refers to gross housebuilding growth in the period 1856-1939; the 1.2 per cent figure to 1947-2019. The European comparative data cover Ireland, France, Belgium, Netherlands, West Germany, Austria, Switzerland, Denmark, Sweden, Norway, and Finland.↩︎
NHS Constitution for England (first published 2010, periodically updated). The right to begin consultant-led treatment for non-urgent conditions within 18 weeks of referral has been part of the Constitution since 2010; the operational standard that at least 92 per cent of patients on incomplete pathways should be waiting under 18 weeks became a statutory requirement in 2012. It is the most operationally specific waiting-time commitment in the Constitution, and the patient right associated with it can be found in the Department of Health and Social Care’s published version.↩︎
Department of Health and Social Care, Reforming elective care for patients (January 2025) and associated NHS England planning guidance. The current government’s restoration of the 92 per cent 18-week standard is accompanied by interim staging targets in 2026 and 2027. The March 2026 interim milestone of 65 per cent of patients beginning treatment within 18 weeks was met at 65.3 per cent, the highest level since November 2021, although approximately four in ten acute NHS trusts did not individually achieve the target, indicating that the national figure masks substantial trust-level variation.↩︎
NHS England, Referral to Treatment Waiting Times statistical series. February 2016 is the most recent month in which the 92 per cent standard was met across the English RTT waiting list as a whole.↩︎
NHS England, Consultant-led Referral to Treatment Waiting Times monthly statistics, March 2019 and September 2023. The September 2023 figure of approximately 7.77 million is the highest recorded peak in the modern series; pathway counts (rather than individual patient counts) are the standard NHS England measure.↩︎
NHS England, Consultant-led Referral to Treatment Waiting Times, March 2026 release. The figures cited - approximately 7.11 million pathways, approximately 2.47 million waiting longer than 18 weeks, approximately 94,000 waiting longer than a year, median wait approximately 11.3 weeks - are reported in the official series and corroborated across credible secondary sources including BMA NHS backlog analysis and the Health Foundation.↩︎
NHS England, NHS Workforce Statistics, January 2025. Vacancy figures are drawn from the same series, March 2025 release. Headcount and full-time equivalent counts are reported separately; the 1.37 million figure refers to FTE. The 2010-2025 growth comparisons (doctors +54 per cent, nurses +31 per cent, allied health +45 per cent, managers +6 per cent) are drawn from the same series.↩︎
NHS Digital, Estates Returns Information Collection (ERIC), multiple years. The maintenance backlog series records the cost of remedial work to bring the NHS estate up to a condition where it would no longer be at risk of failure or no longer constitute a hazard. The “high risk” share has grown materially over the same period, though specific high-risk figures vary by reporting year and definition.↩︎
OECD Health Statistics, Health expenditure by function series. Administrative spending shares as a percentage of total current health expenditure are the standard cross-national comparison. Figures cited reflect recent reporting years and may vary by precise definition of “administration” used in source statistics.↩︎
Community Health Councils in England were abolished under the National Health Service Reform and Health Care Professions Act 2002, taking effect in 2003. They were replaced sequentially by Patients’ Forums, Local Involvement Networks (LINks), and from 2013 by Healthwatch England and local Healthwatch organisations. The claim here is that the successor bodies have less independent institutional standing than the CHCs they replaced; for a fuller discussion see relevant Health Foundation and King’s Fund reviews of patient and public involvement in the NHS.↩︎
Institute for Fiscal Studies, Public Spending on Health and Social Care (various years); HM Treasury Public Expenditure Statistical Analyses (annual series). The share of total departmental public spending allocated to health and social care has risen substantially over the period 1998/99 to the present, reflecting both real-terms growth in the health budget and slower growth in several other departmental areas.↩︎
Health Foundation, British Social Attitudes Survey: Public satisfaction with the NHS and social care in 2024 (published 2025). The 21 per cent figure is the lowest recorded in the BSA series, which began asking the satisfaction question in 1983.↩︎
Climate Change Act 2008 (as amended 2019). The 2019 amendment established the legal commitment to net zero greenhouse gas emissions by 2050. Carbon budgets - five-year statutory caps on total emissions - are set on the advice of the Climate Change Committee, the independent statutory advisory body established by the Act.↩︎
HM Government, Clean Power 2030 Action Plan (December 2024). The plan sets out the institutional and infrastructure changes required to deliver approximately 132 GW of renewable and low-carbon generation capacity by 2030. The 132 GW figure is the headline capacity target; the underlying generation-mix assumptions are subject to ongoing revision as deployment proceeds.↩︎
Ofgem, Default Tariff Cap statistical series. The cap was introduced under the Domestic Gas and Electricity (Tariff Cap) Act 2018 and first took effect on 1 January 2019 at a level of £1,137 for typical dual-fuel consumption.↩︎
Ofgem, Default Tariff Cap announcements, April 2022 through April 2026. The 35 per cent above pre-crisis figure compares the April 2026 cap with the January 2019 introductory level in nominal terms; real-terms comparisons depend on the inflation deflator chosen and are not used here to avoid overstating precision.↩︎
For an introduction to marginal pricing in GB electricity markets, see Ofgem, Review of GB Electricity Market Arrangements (REMA) consultation documents (multiple years), and the Climate Change Committee, The Sixth Carbon Budget (2020), chapter on power sector decarbonisation. The marginal pricing structure means that gas-fired generation, when it sets the price, links UK electricity costs to global gas markets across most settlement periods.↩︎
National Energy System Operator (NESO), formerly National Grid ESO, Connections Reform policy documents and grid connection queue statistics, multiple releases 2023-2025. The peak queue figure, in excess of 700 gigawatts, is the total of generation, storage, and demand projects with queue positions at the height of the queue’s growth, prior to the connections reform that began in 2025. Specific gigawatt totals depend on the precise reporting moment and on whether transmission and distribution queues are counted together; the order of magnitude is robust across sources.↩︎
National Energy System Operator (NESO), Connections Reform - Final Decision (December 2025). The reform prioritises projects aligned with the Clean Power 2030 capacity pathway and creates staged connection windows for projects targeting 2035. The reform’s outcomes are at the time of writing prospective; this paper does not claim that the reform has succeeded, only that its necessity is evidence of the prior dysfunction.↩︎
National Energy System Operator (NESO), Future Energy Scenarios and transmission demand queue statistics, November 2024 and June 2025 reporting points. The surge in transmission demand applications reflects principally the early stages of large-scale data centre construction, electrification of heat (heat pumps) and transport (electric vehicles), and emerging industrial decarbonisation requirements.↩︎
Education Policy Institute, Annual Report 2025: Disadvantage (July 2025), particularly Figure D3 and the secondary phase analysis. The disadvantage gap measure expresses the difference between the average attainment of pupils eligible for free school meals and their non-disadvantaged peers in equivalent months of educational development. Reception (age 5) gap in 2024 was 4.7 months; KS2 gap was 10.0 months; KS4 gap was 19.1 months, of which 22.4 months for persistently disadvantaged pupils specifically. The KS4 gap was 18.1 months in 2019 and peaked at 19.2 months in 2023.↩︎
Department for Education, Key stage 4 performance, 2024 (October 2024). The headline measure cited is the percentage of pupils achieving grade 5 (a “strong pass”) or above in both English and mathematics GCSE.↩︎
For the longer-running time series and discussion of when the narrowing stalled, see Education Policy Institute, Annual Report on Disadvantage, multiple years. EPI records initial progress in narrowing the KS4 gap from approximately 19.7 months in 2011 to 18.2 months in 2014, with the gap then broadly stable at around 18 months until the pandemic, after which it widened to a peak of 19.2 months in 2023 before narrowing marginally to 19.1 months in 2024. The “lost decade” or “stalled progress” characterisation used in some EPI commentary reflects this trajectory; the precise turning point depends on the measure used.↩︎
Department for Education, Initial Teacher Training recruitment data, multiple years; National Foundation for Educational Research (NFER) analysis of teacher retention. Specific shortage subjects (physics, mathematics, modern foreign languages, computing) have missed recruitment targets in most recent years; retention within the first five years of qualifying has weakened over the past decade.↩︎
Department for Education, Education, Health and Care Plans (EHC plans): England, January 2024 (2024). The January 2024 total of 576,000 EHCPs represents an approximate 140 per cent increase from the January 2015 baseline. The wider “SEN support” population, identified in school without an EHCP, is larger again.↩︎
County Councils Network and Local Government Association, joint statements on SEND high needs funding (multiple years 2023-2025); HM Treasury, Statutory Override extension documentation. The £8 billion cumulative deficit figure is a projection by local government bodies based on current trajectory; the statutory override allows local authorities to keep high-needs deficits off their main accounts until March 2028.↩︎
Department for Education, EHC plans statistics: timeliness of issuing data. The 1-100 per cent range refers to local authorities’ performance against the statutory 20-week deadline for issuing an EHCP from the point of initial request. The variation is substantially larger than for most other statutory local authority functions.↩︎
HM Courts and Tribunals Service, Special Educational Needs and Disability Tribunal annual statistics. The proportion of cases either won by appellants or decided in their favour through consent orders has been in the approximate 95-99 per cent range across recent reporting years, suggesting that the underlying local authority decisions being appealed are not, on average, being made in accordance with the statutory standard.↩︎